Trends
EMSE 4572/6572: Exploratory Data Analysis
John Paul Helveston
October 28, 2026
Quiz 4
Write your name on the quiz!
Rules:
- Work alone; no outside help of any kind is allowed.
- No calculators, no notes, no books, no computers, no phones.

Points
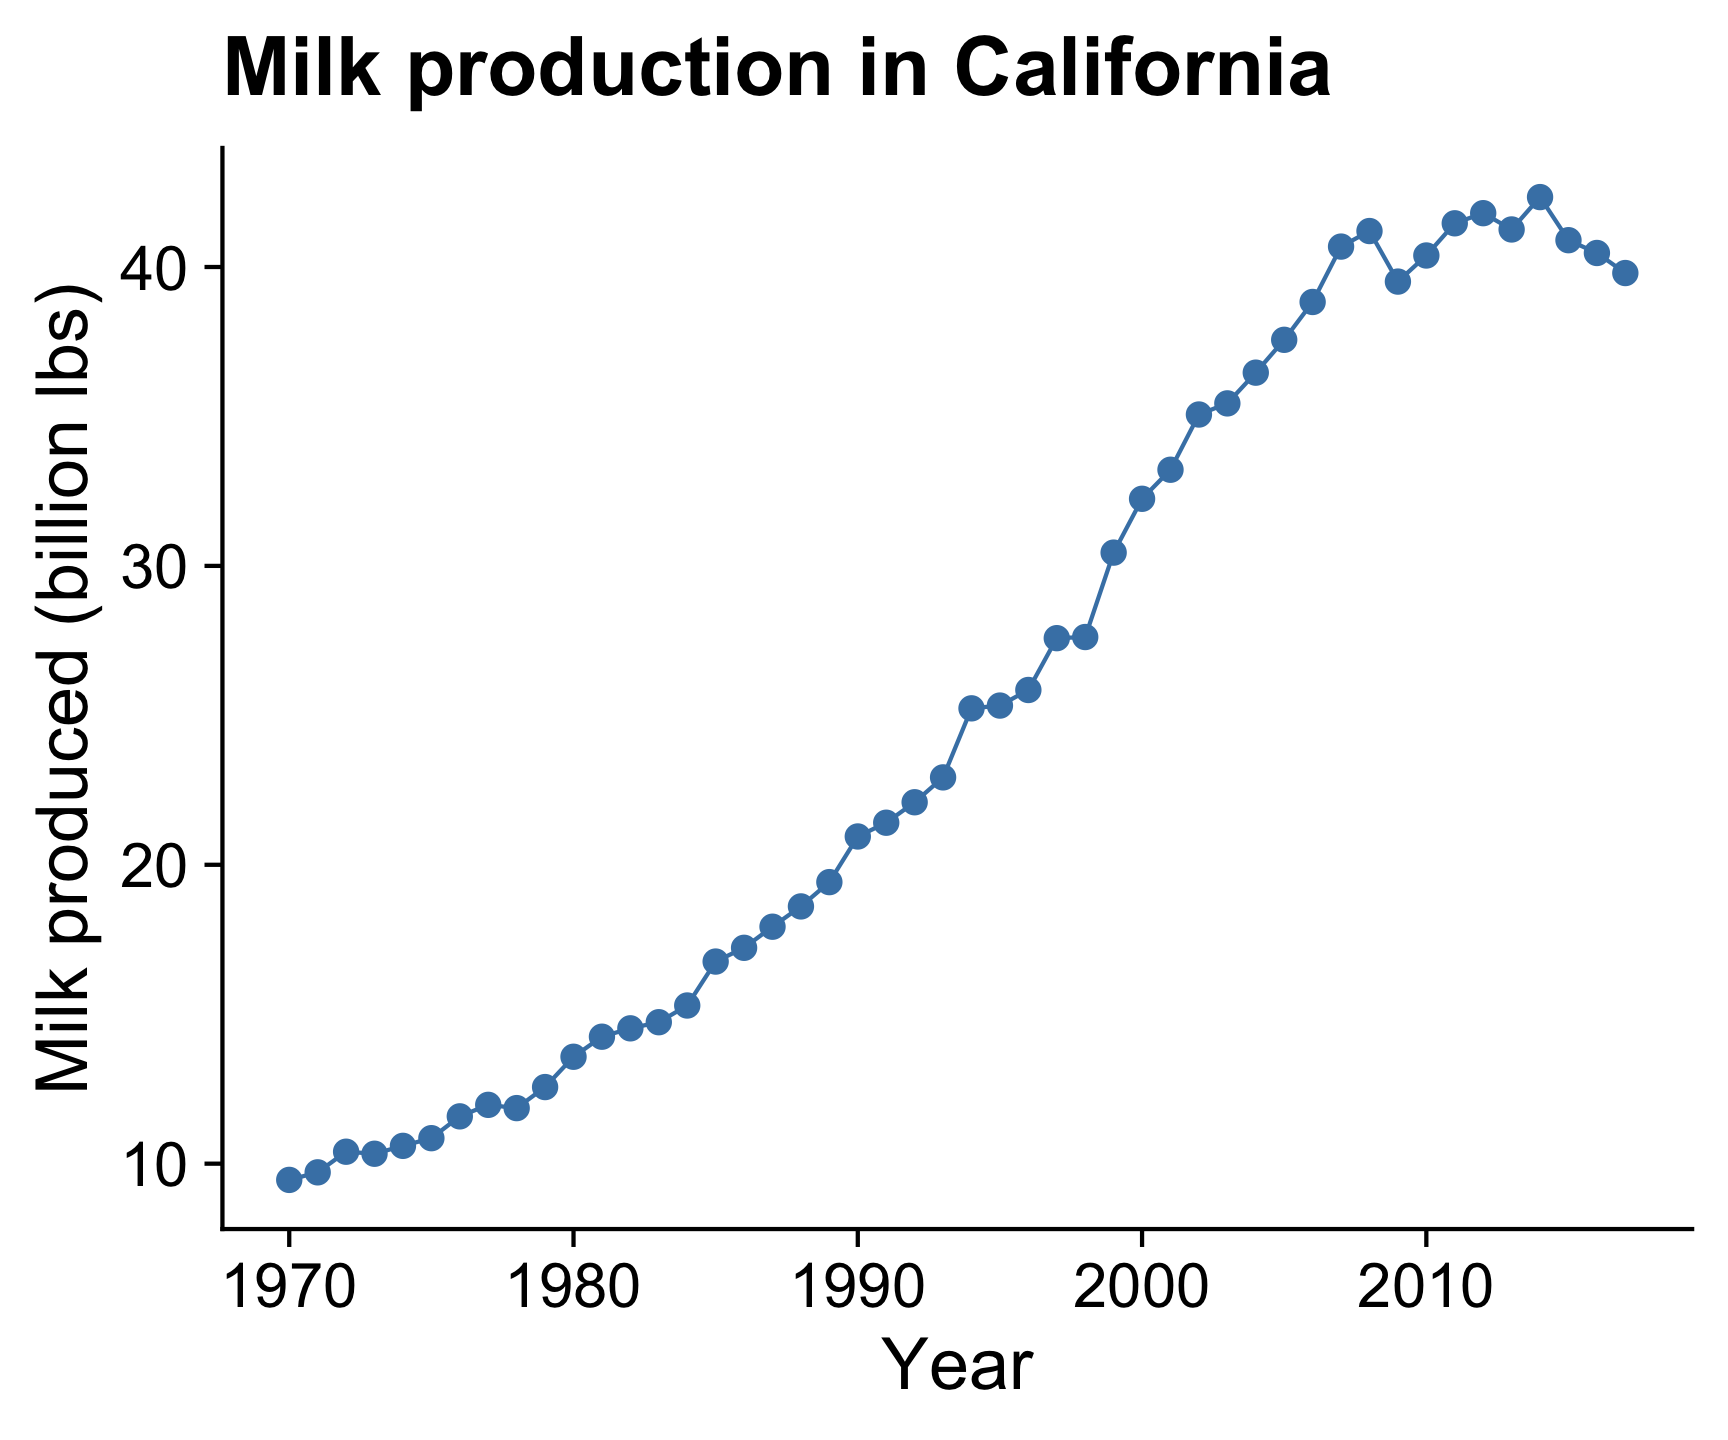
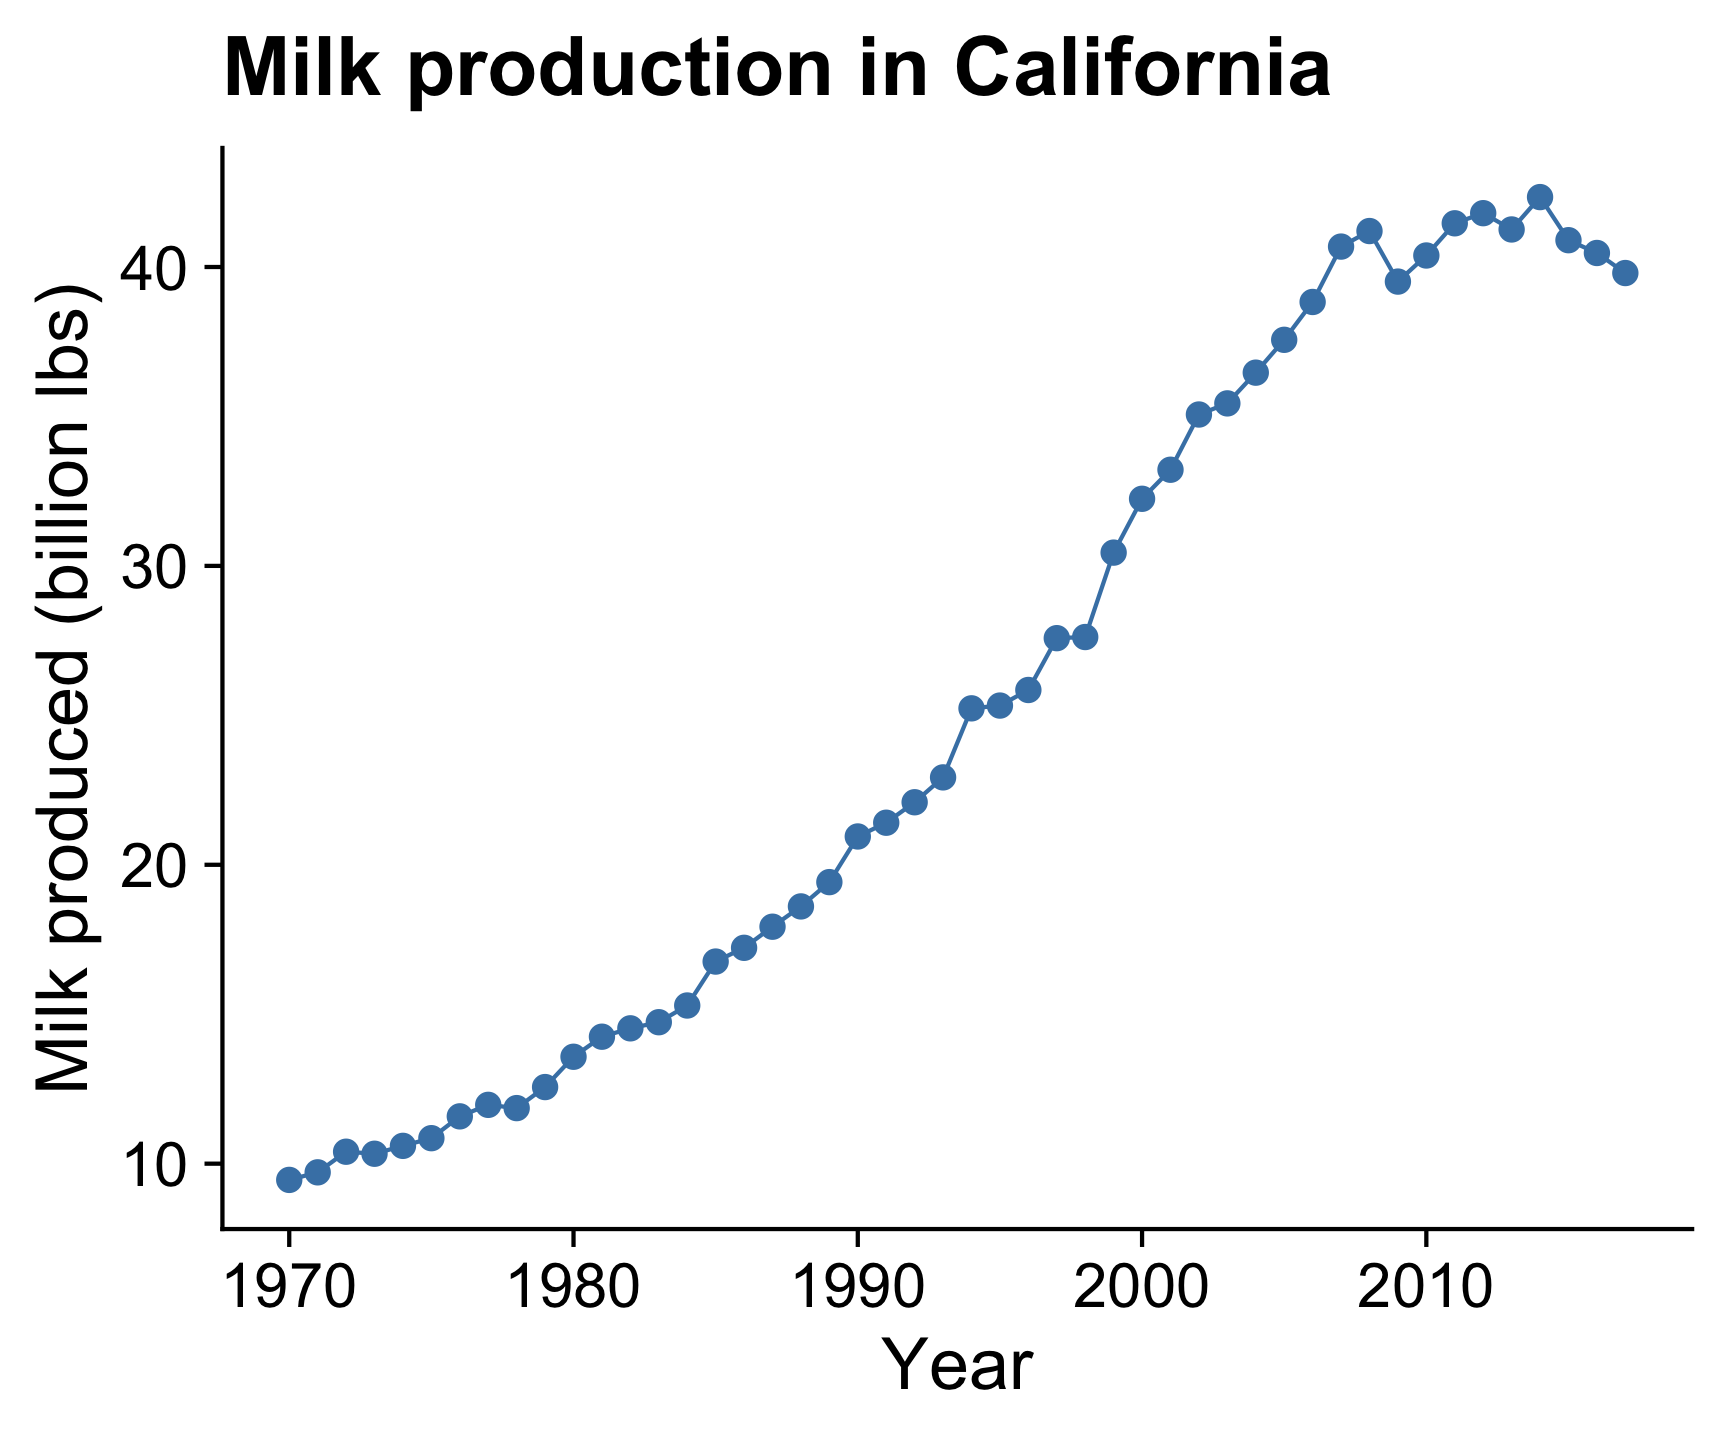
Plotting the data points is a good starting point for viewing trends

Points + line
Adding lines between the points helps
see the overall trend
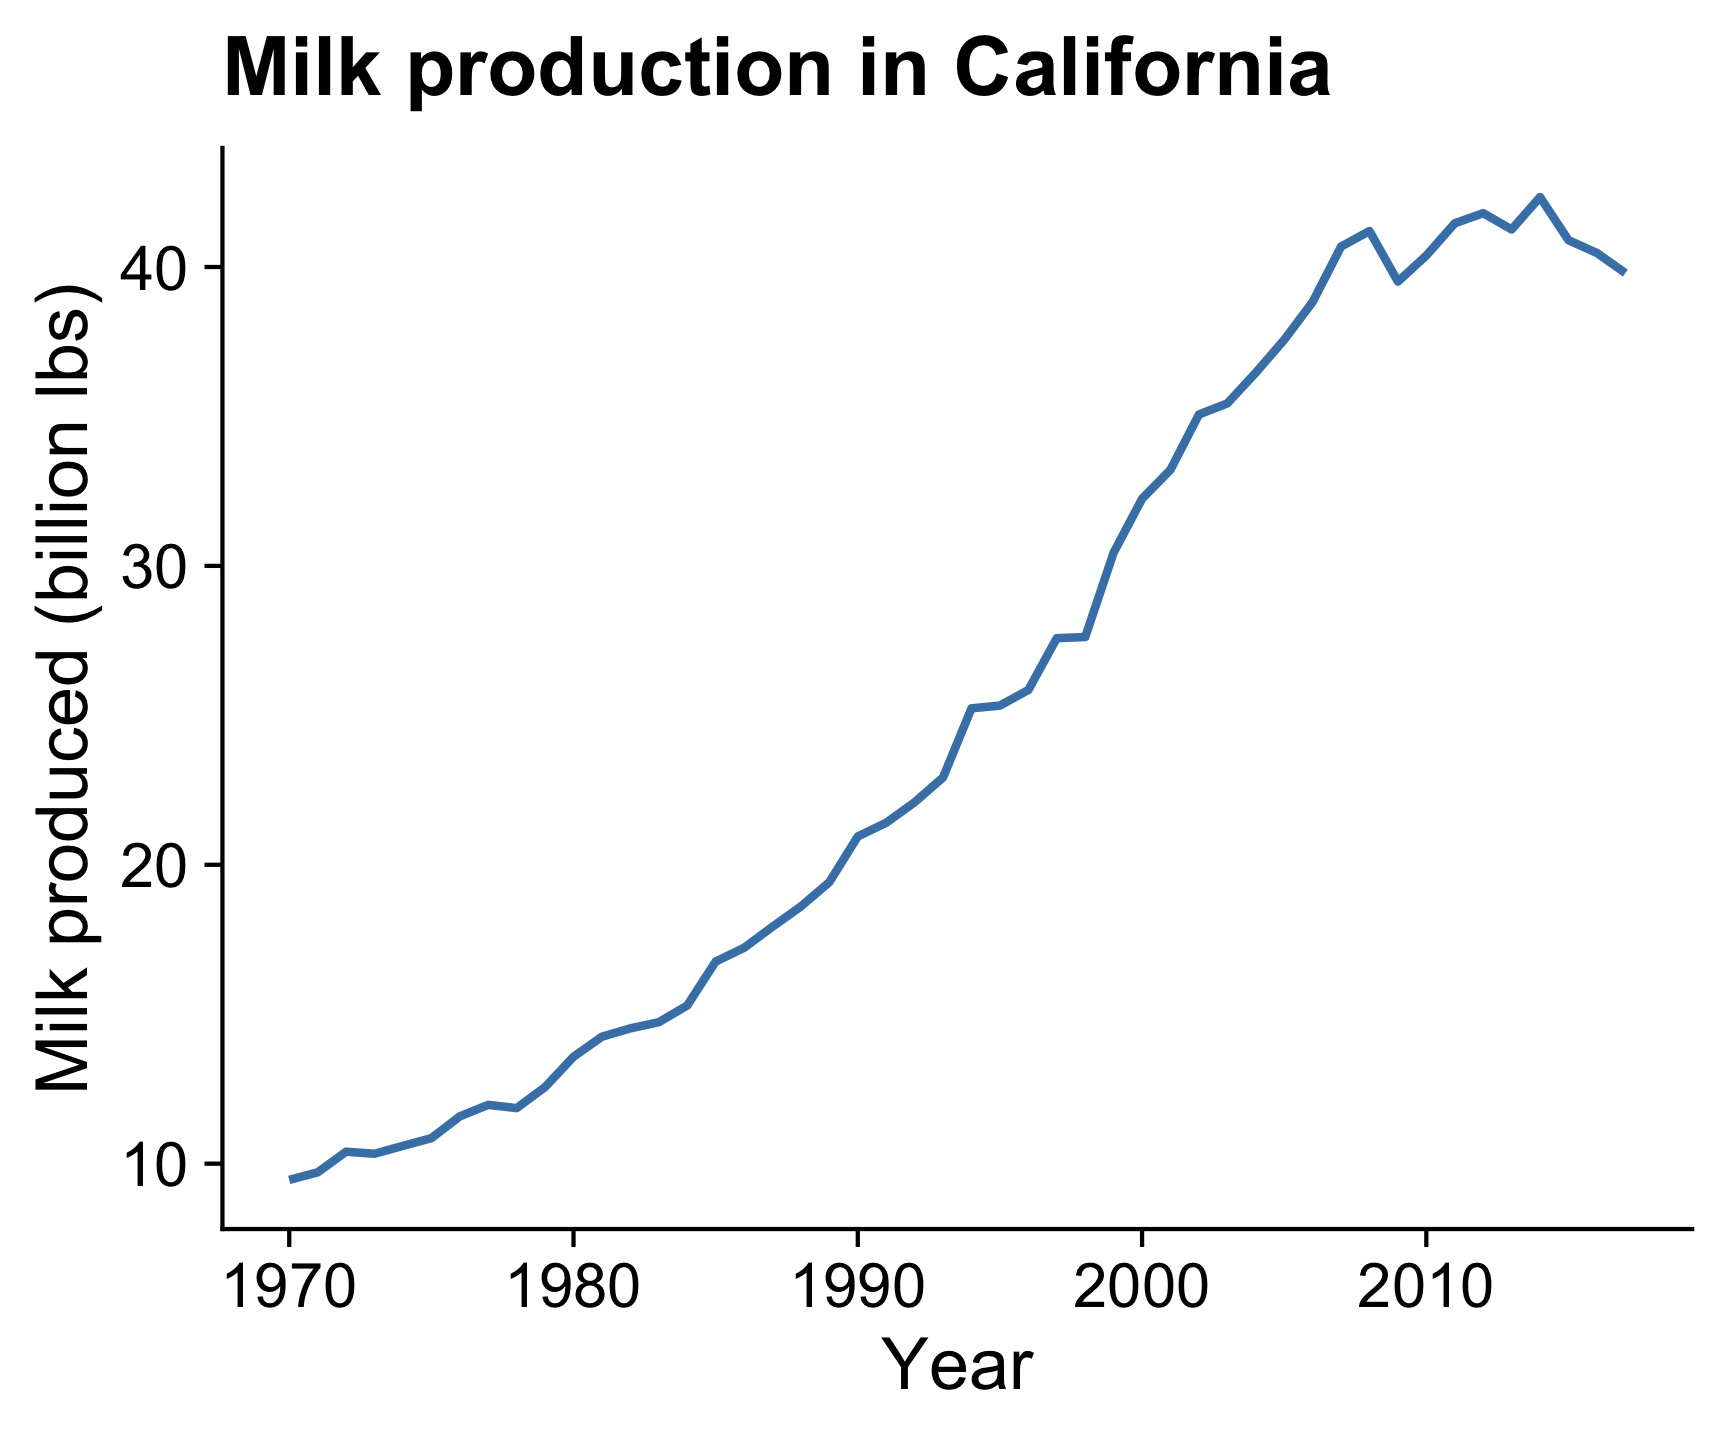
Line
Omitting the points emphasizes the overall trend
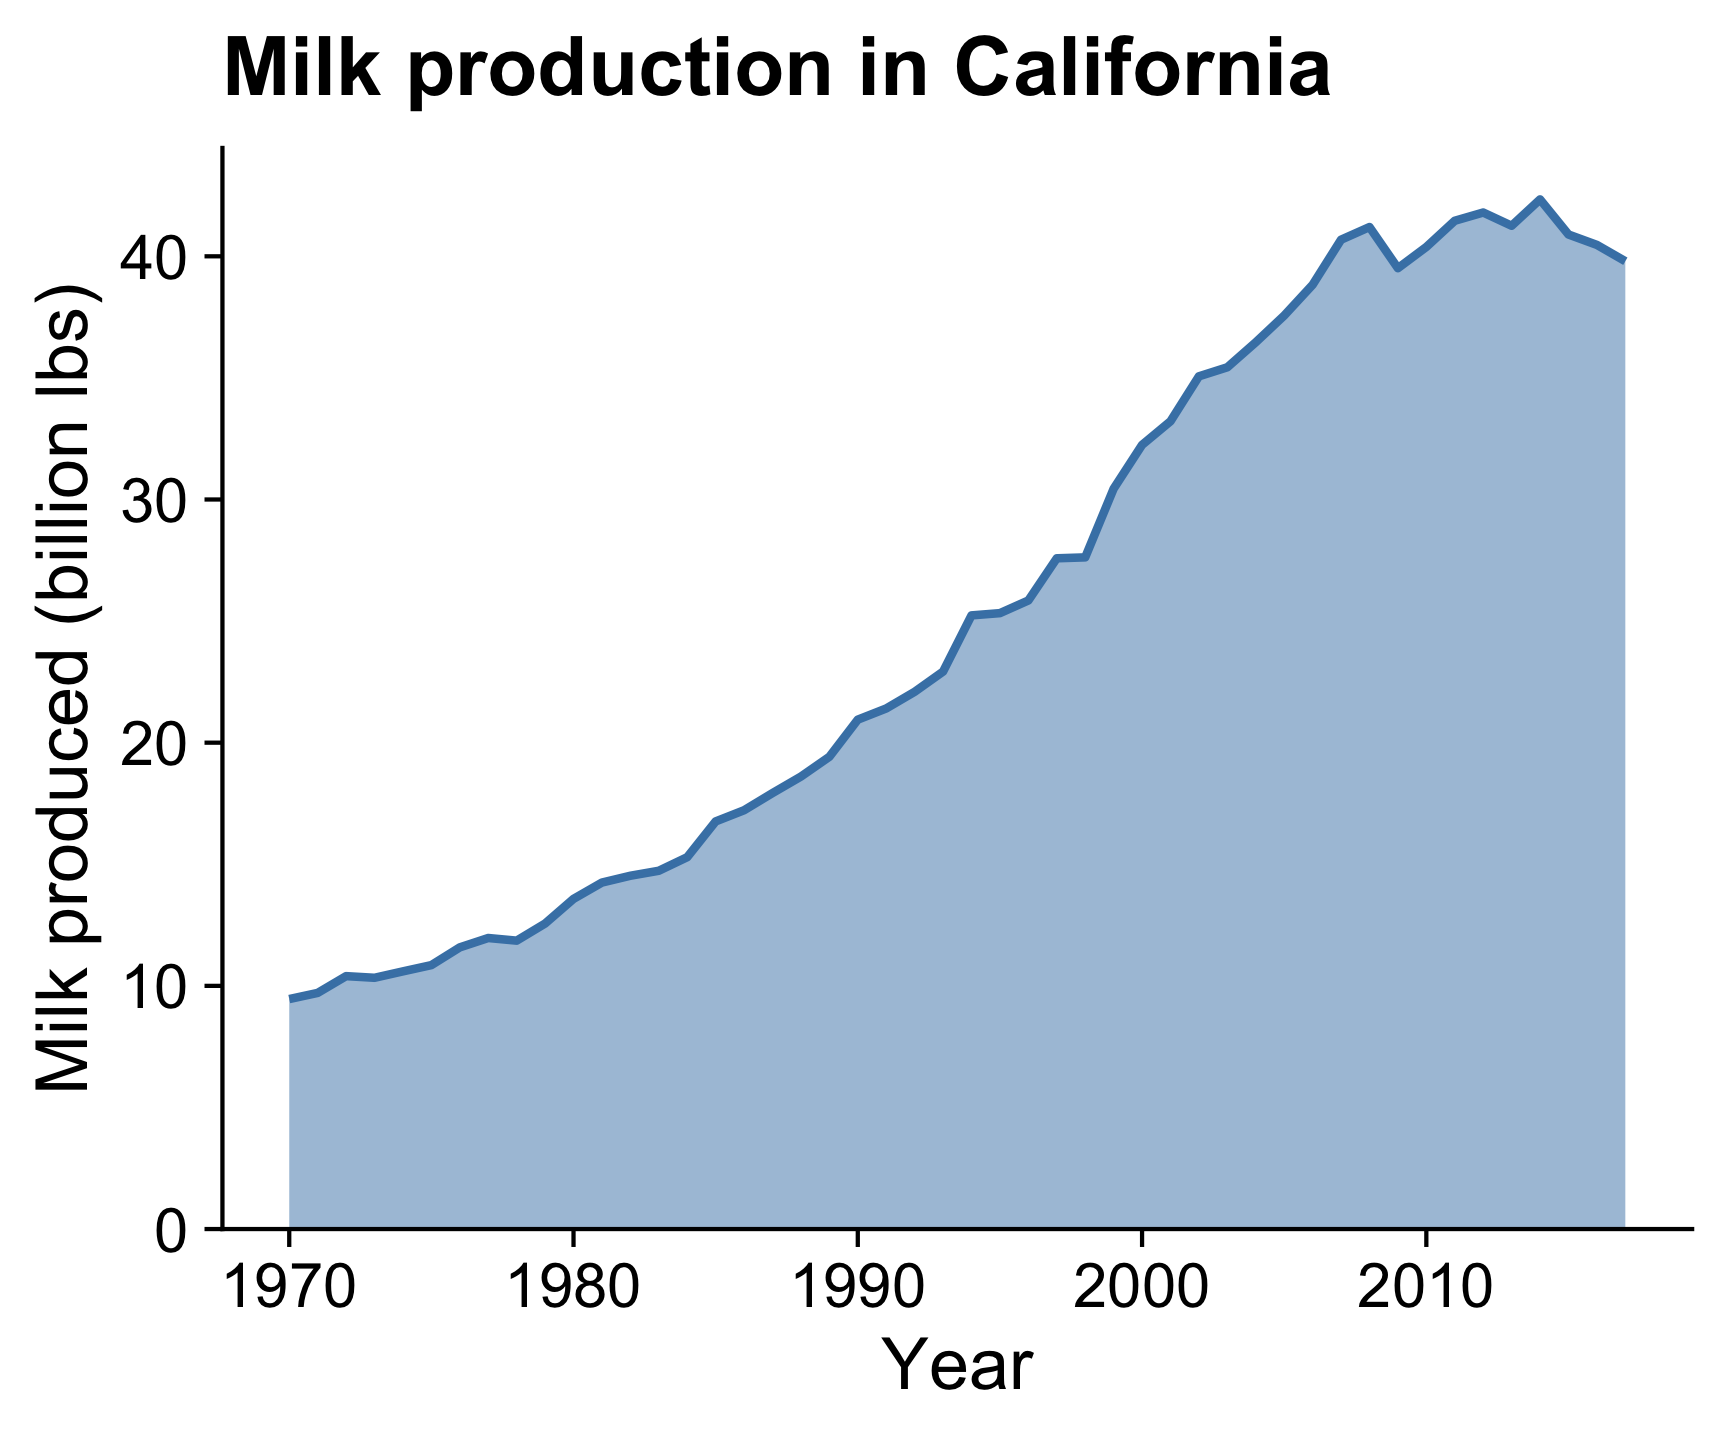
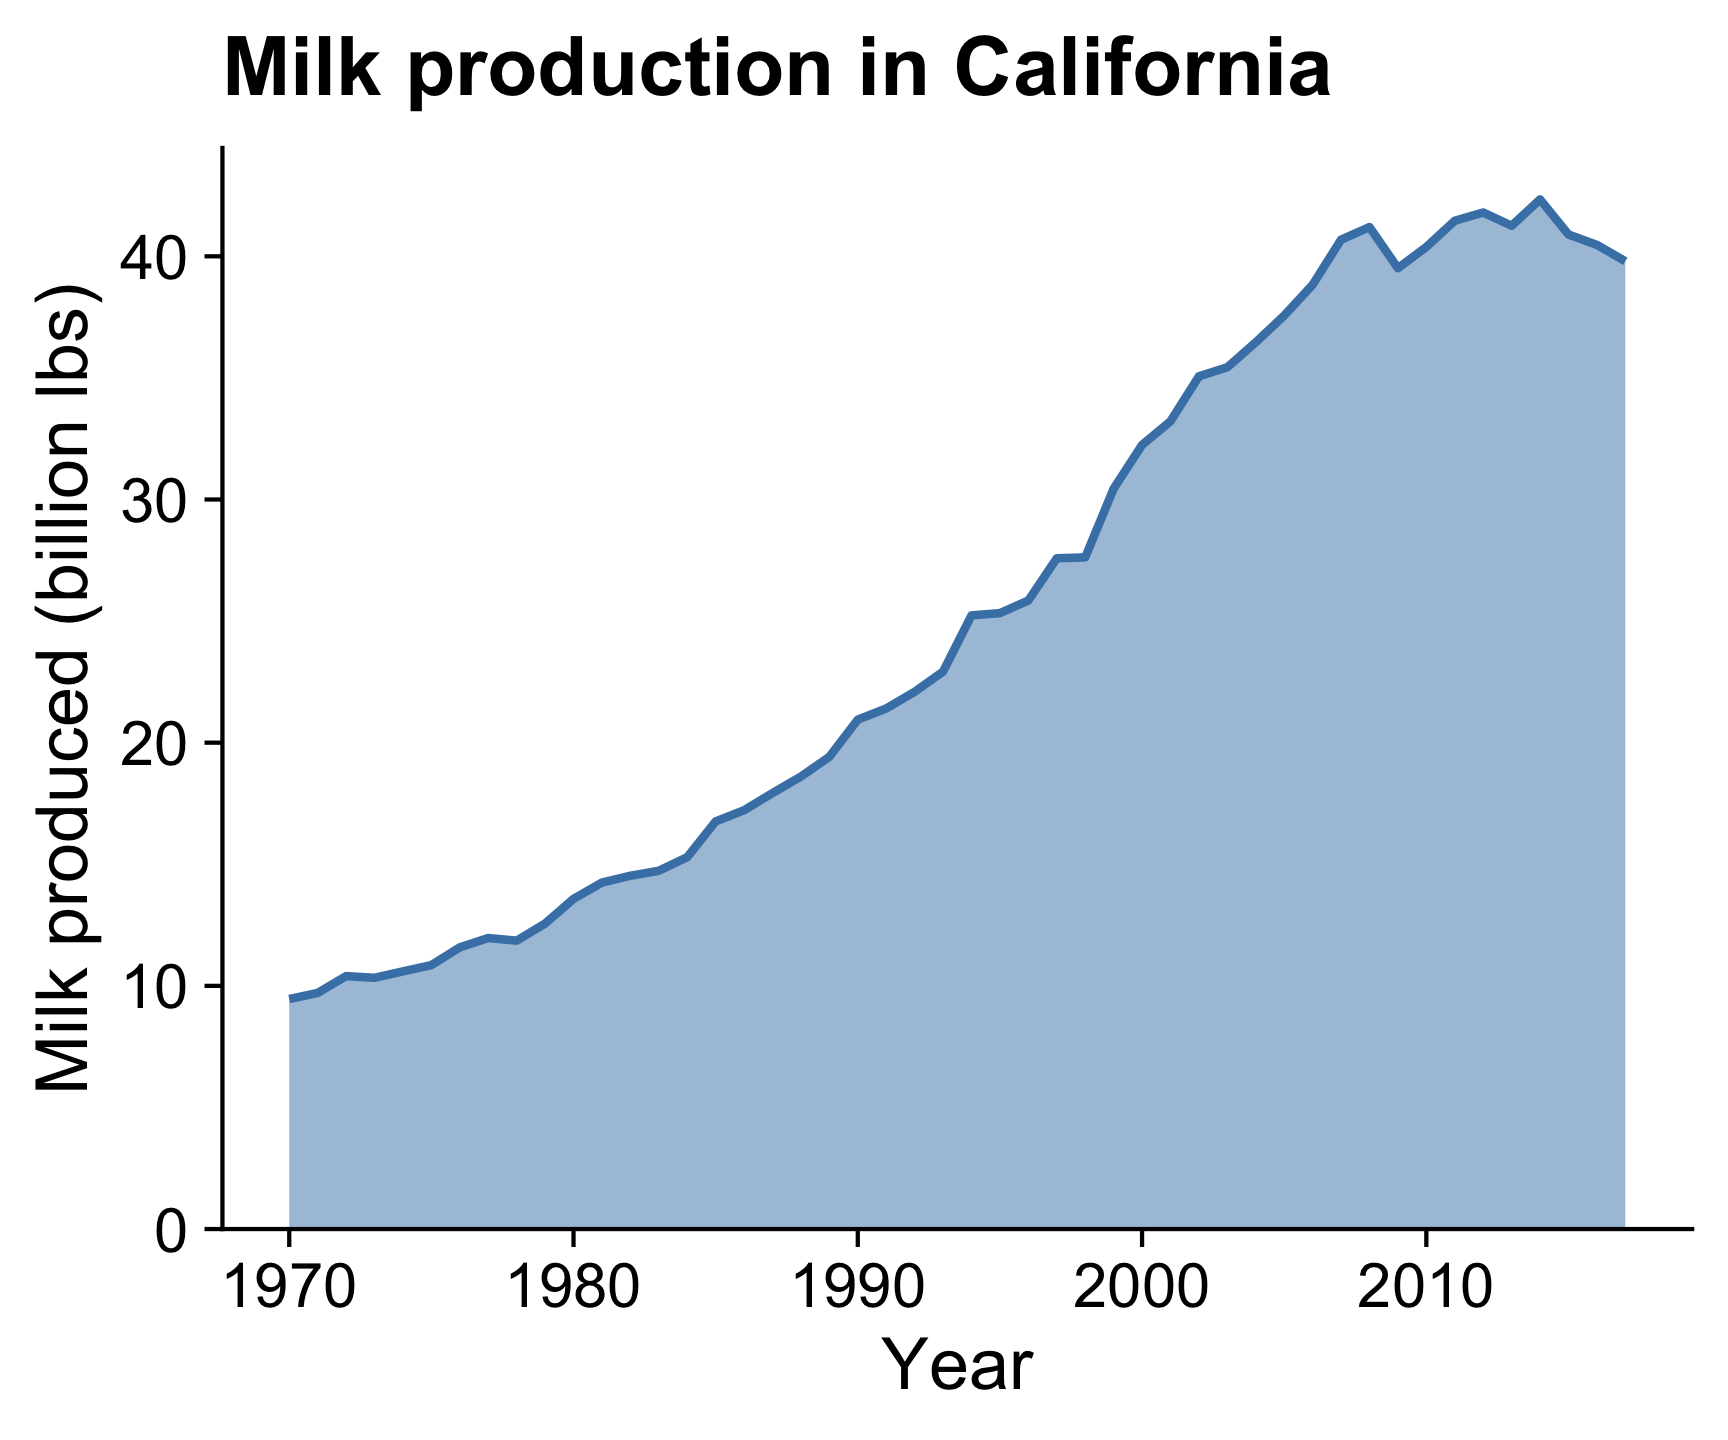
Line + area
Filling area below line emphasizes cumulative over time
(y-axis should start at 0)
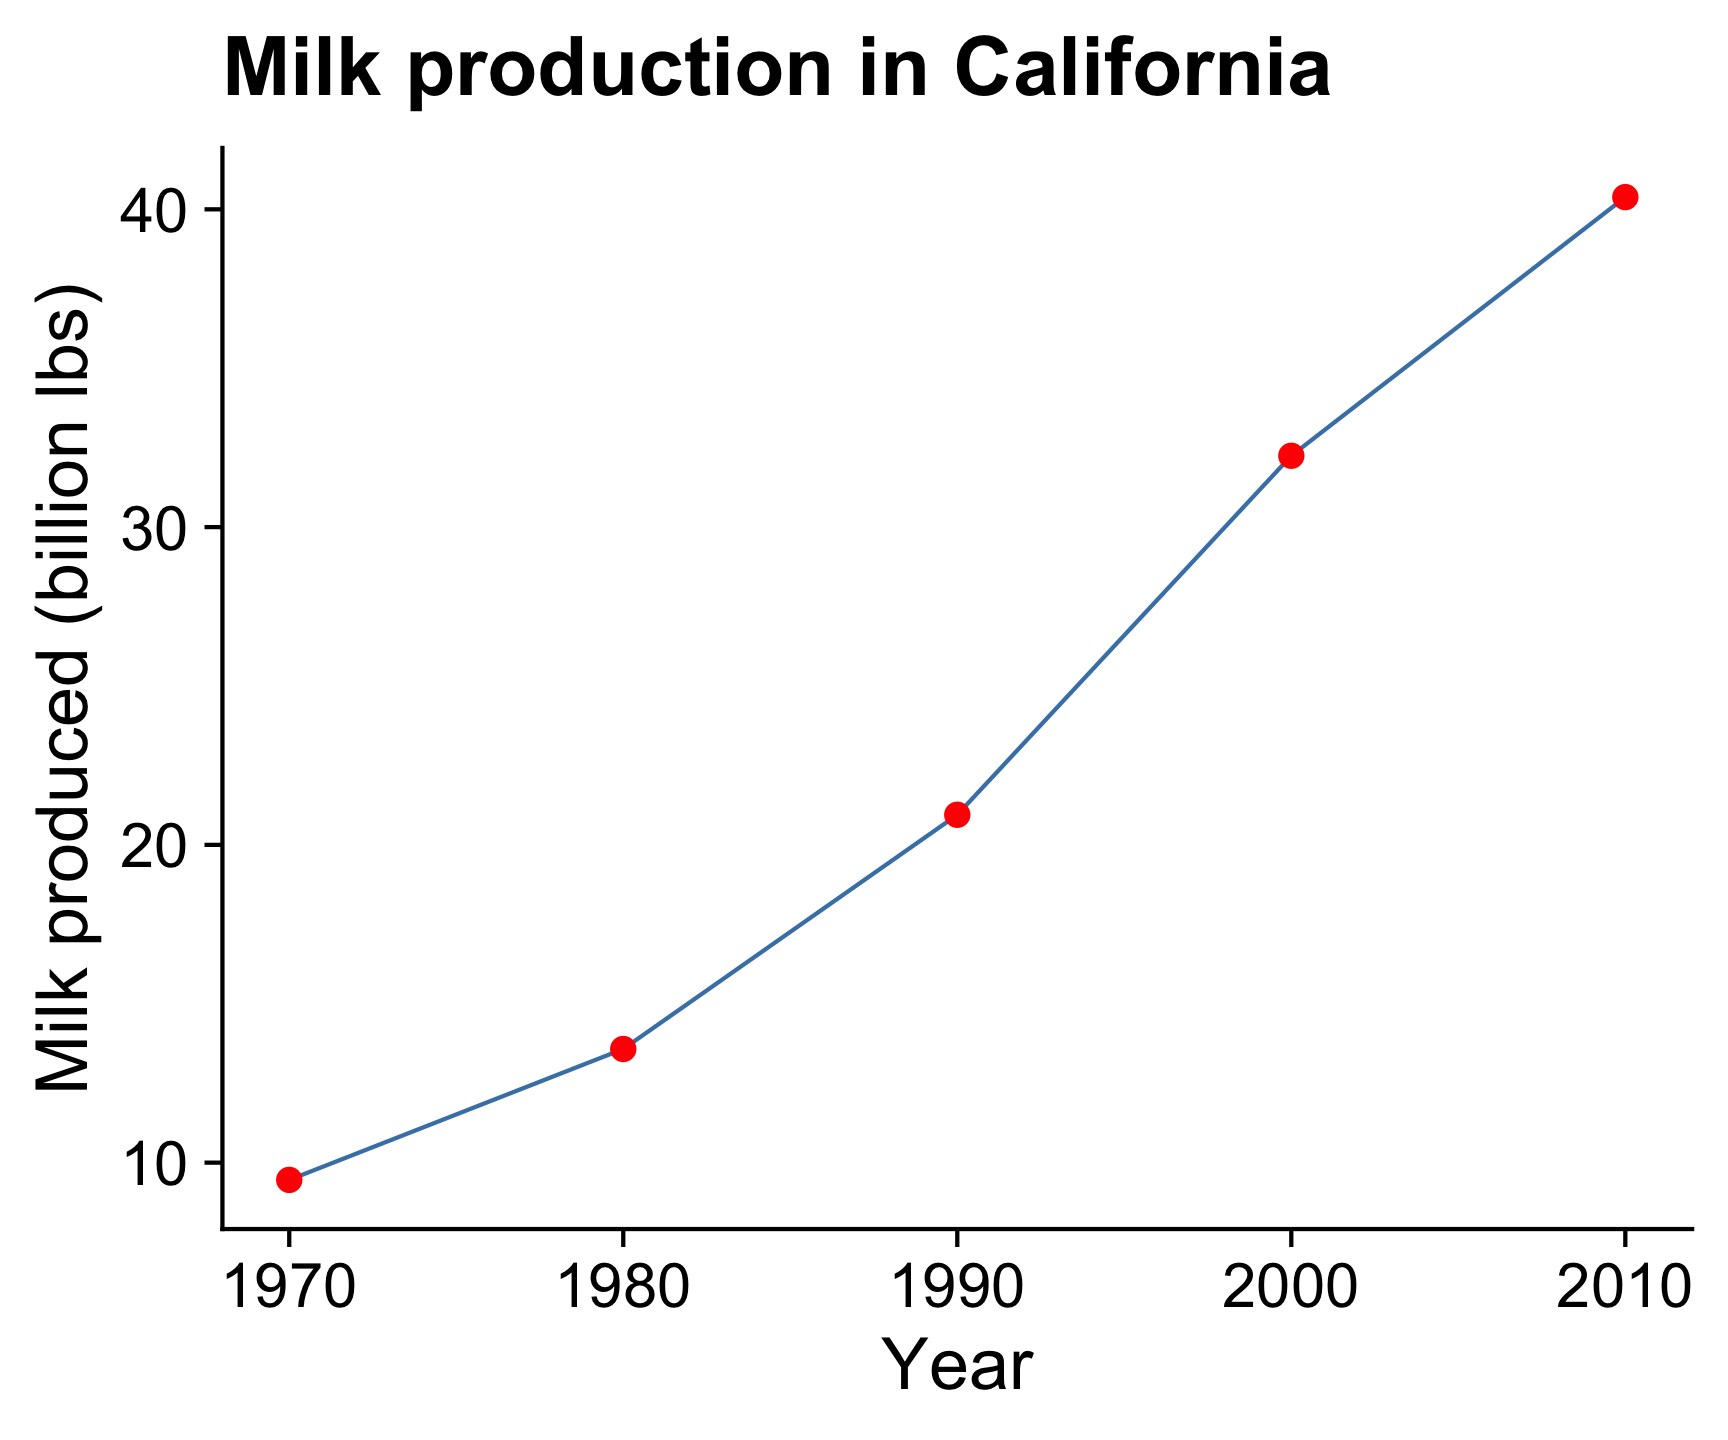
If points are too sparse, a line can be misleading

Smoothed line
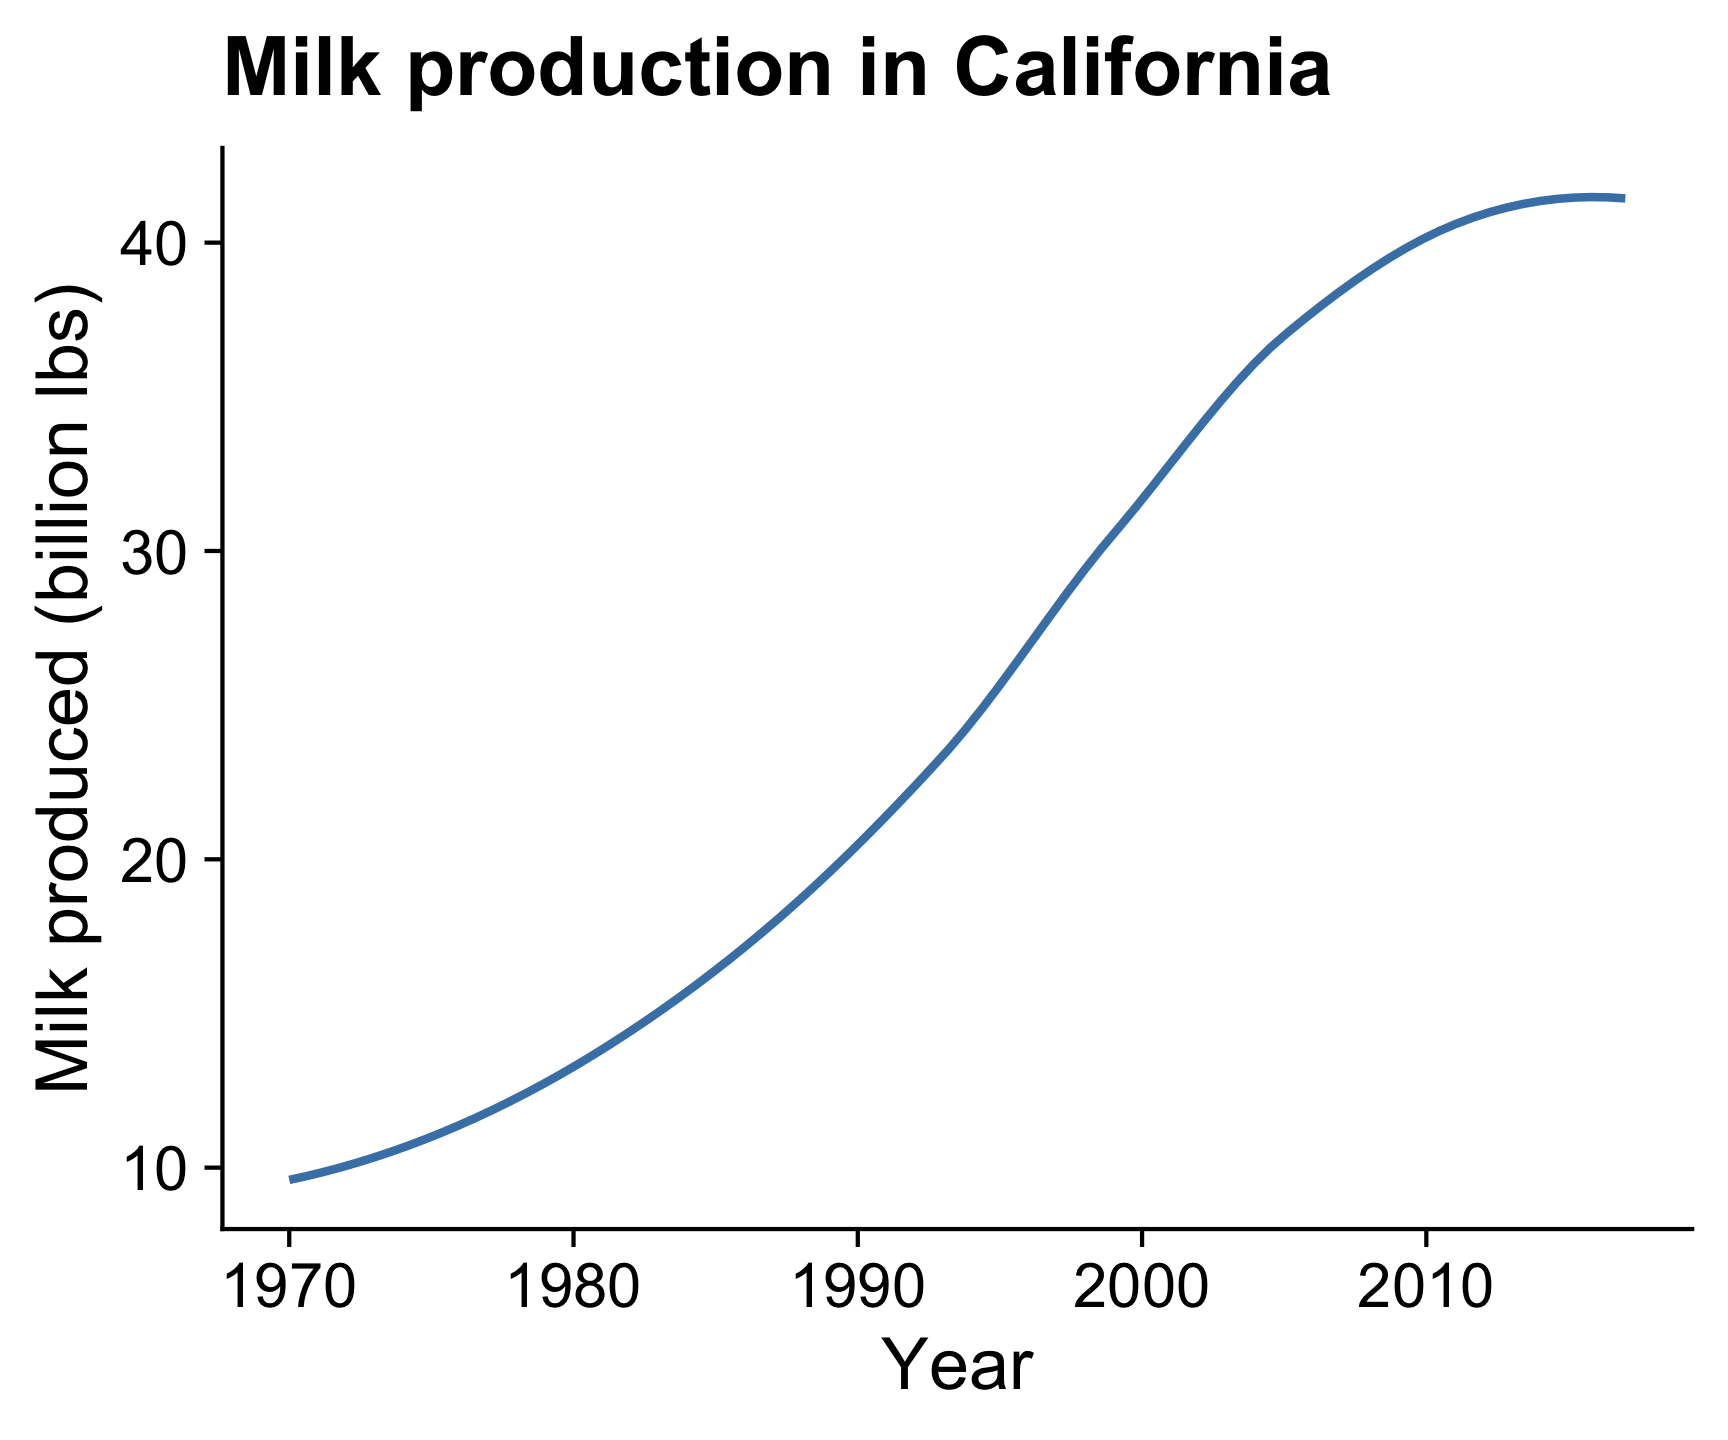
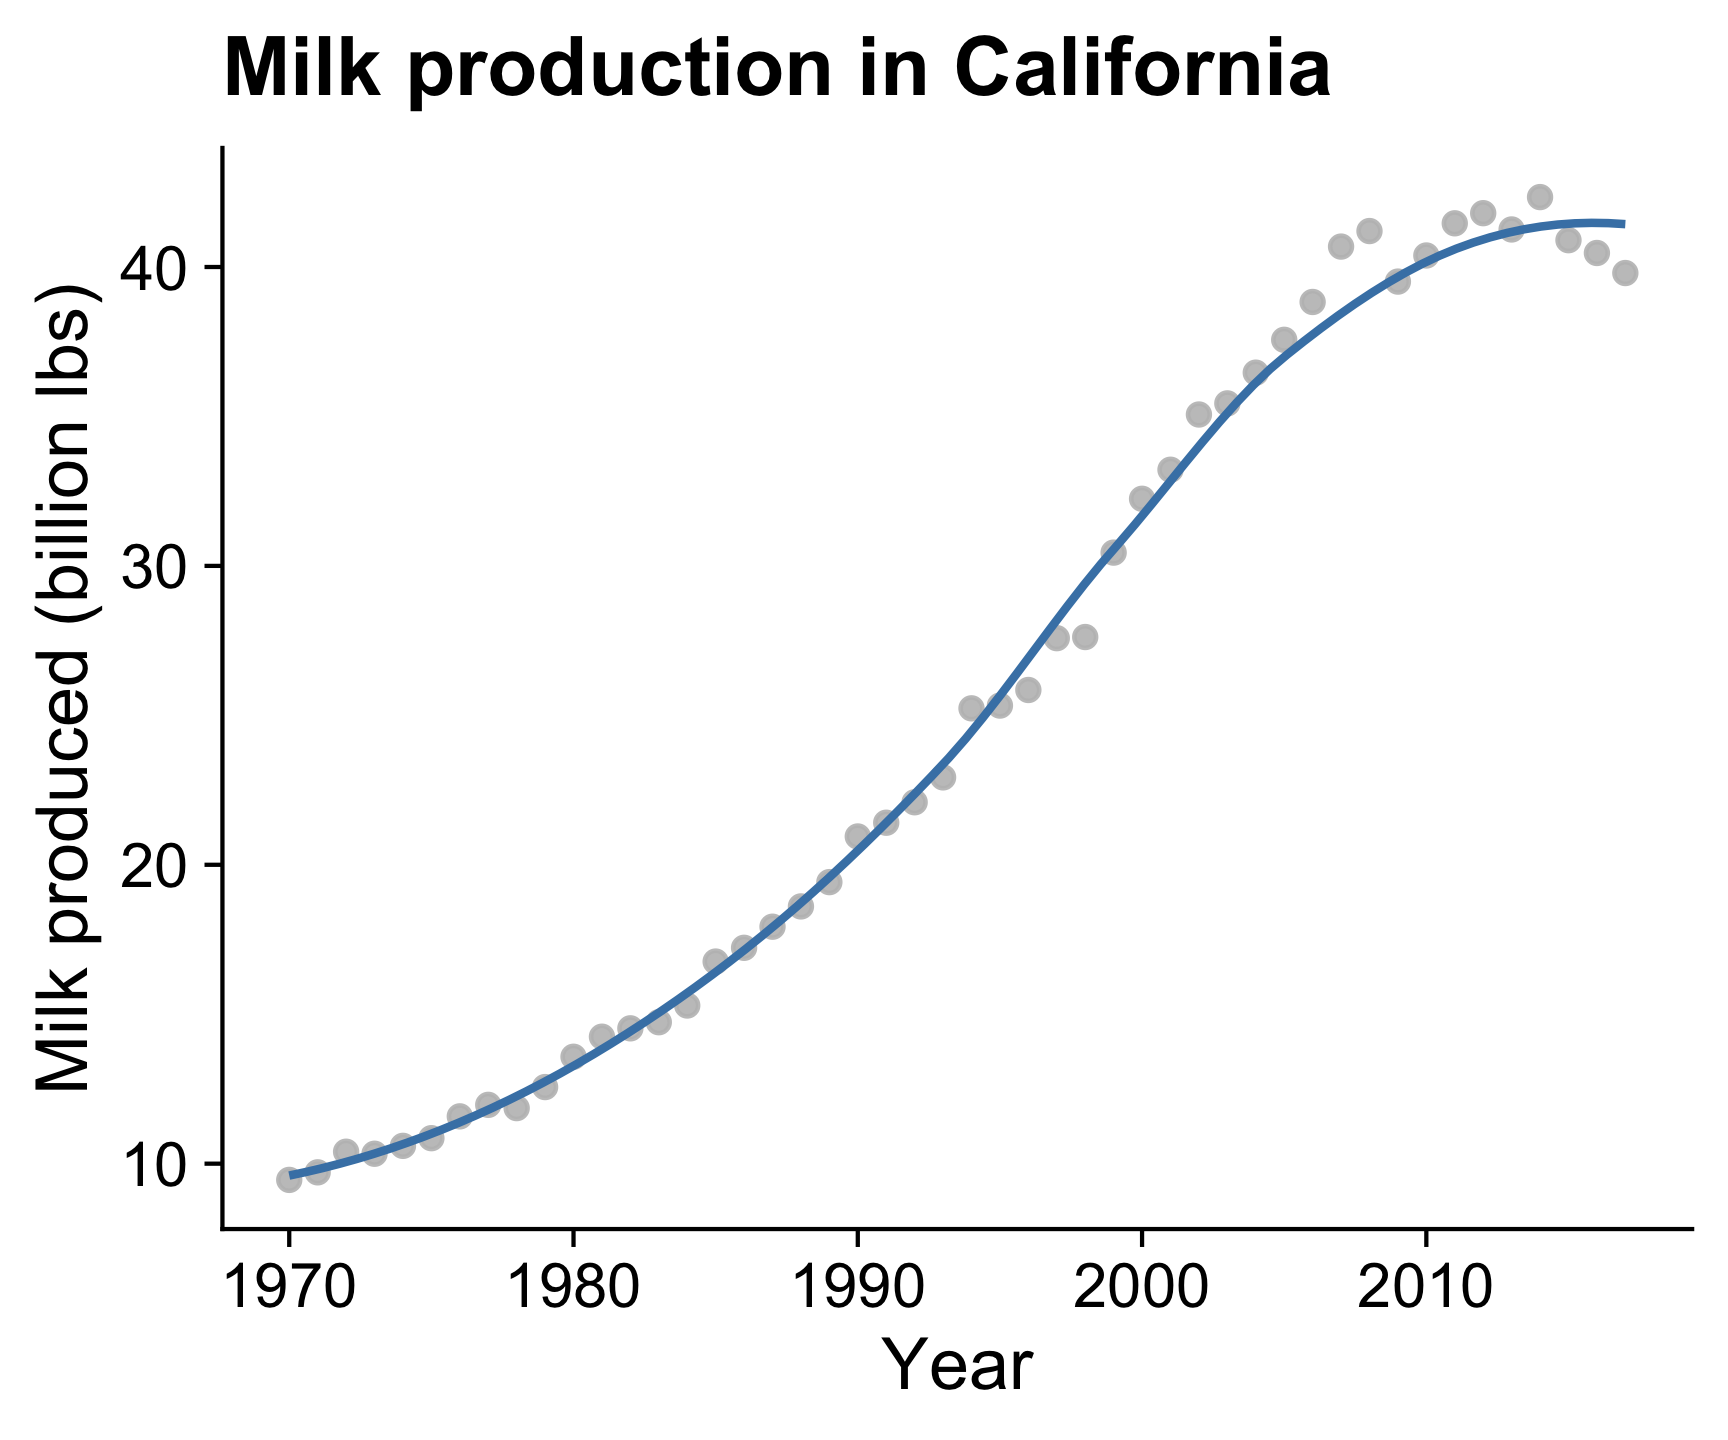
Adding a “smoothed” line shows a modeled representation of the overall trend
Smoothed line + points
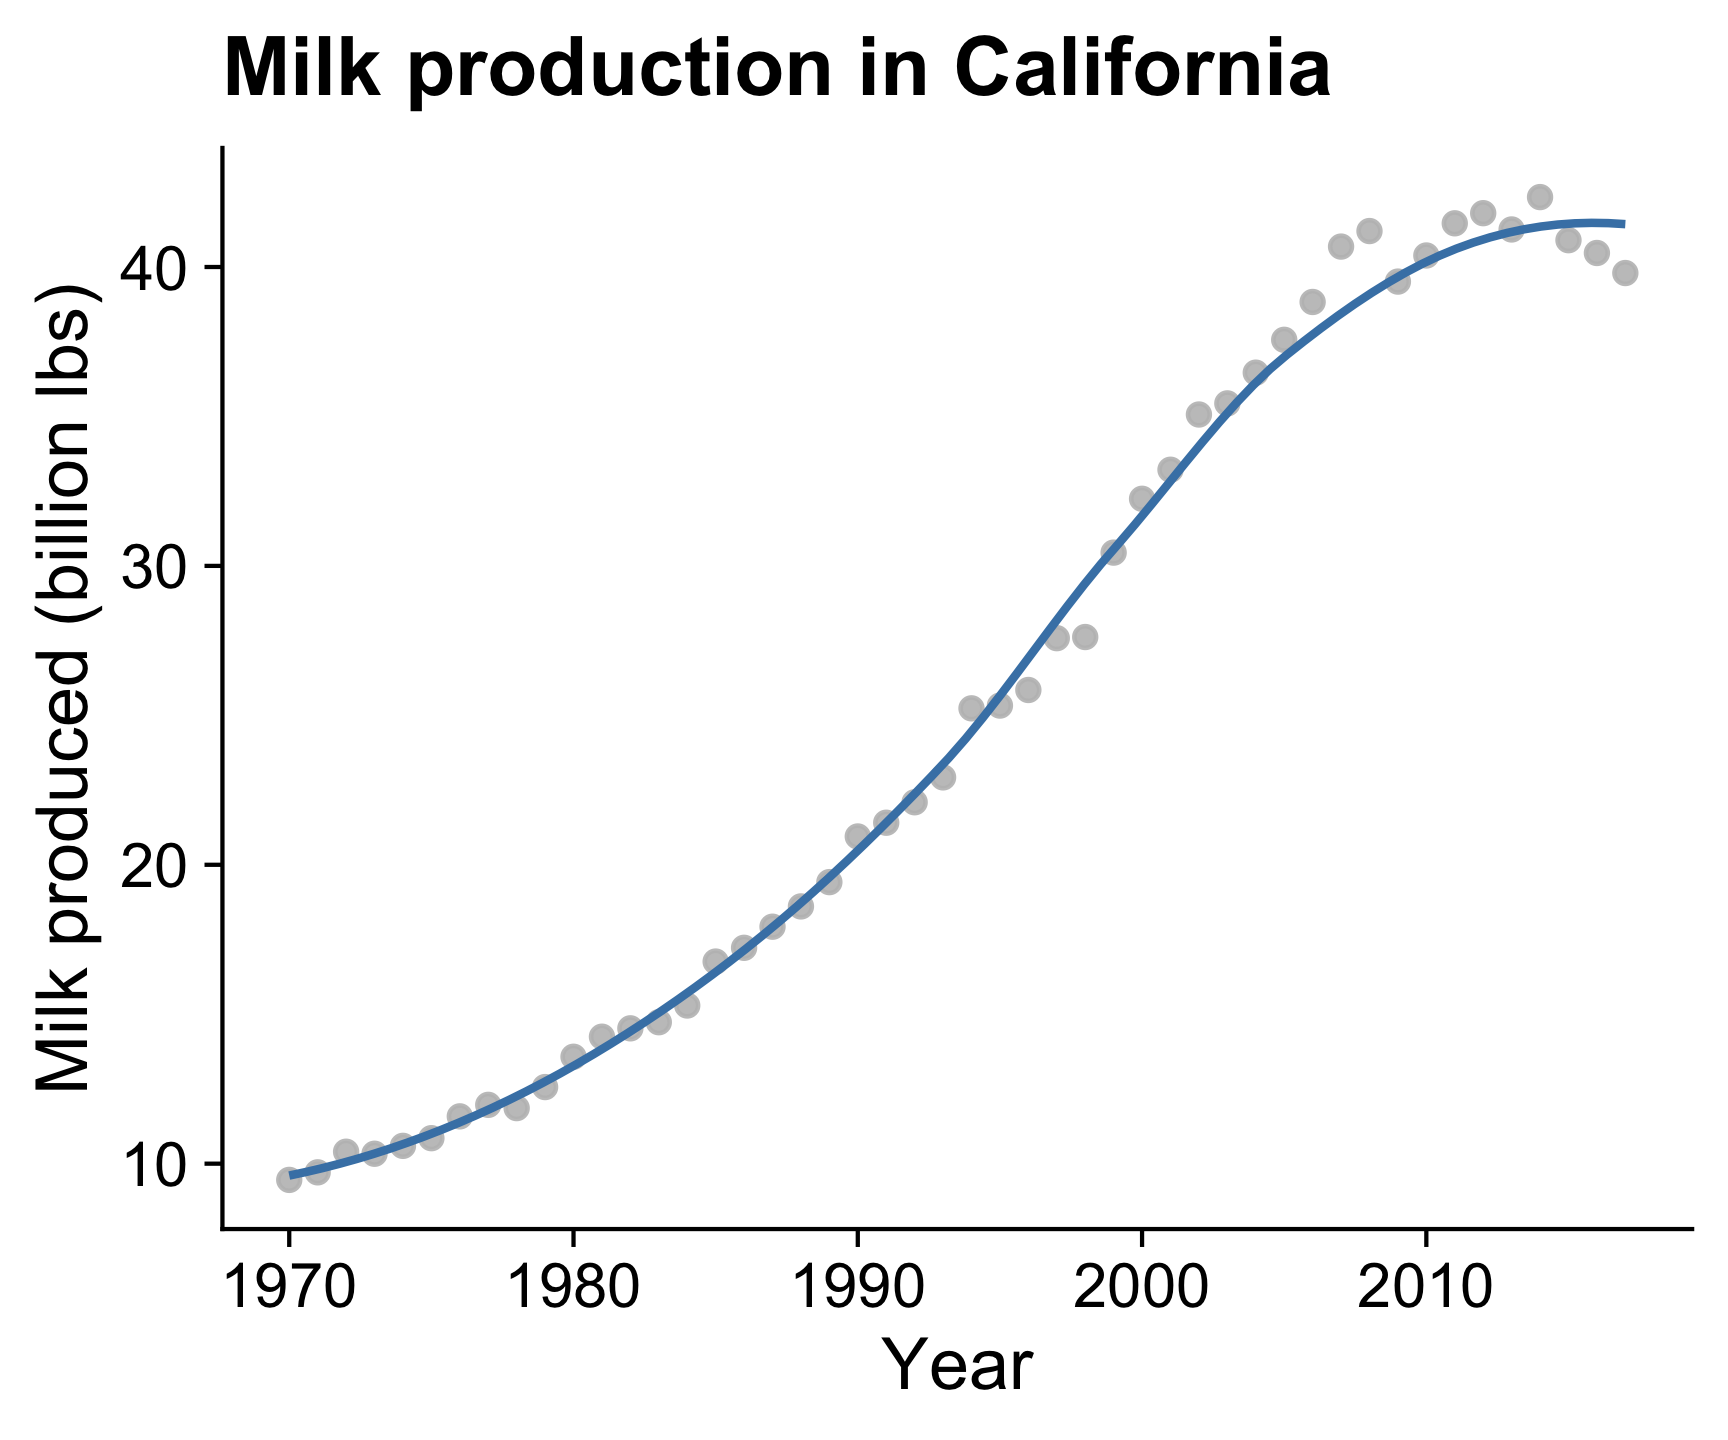
Putting the smoothed line over the data points helps show whether outliers are driving the trend line
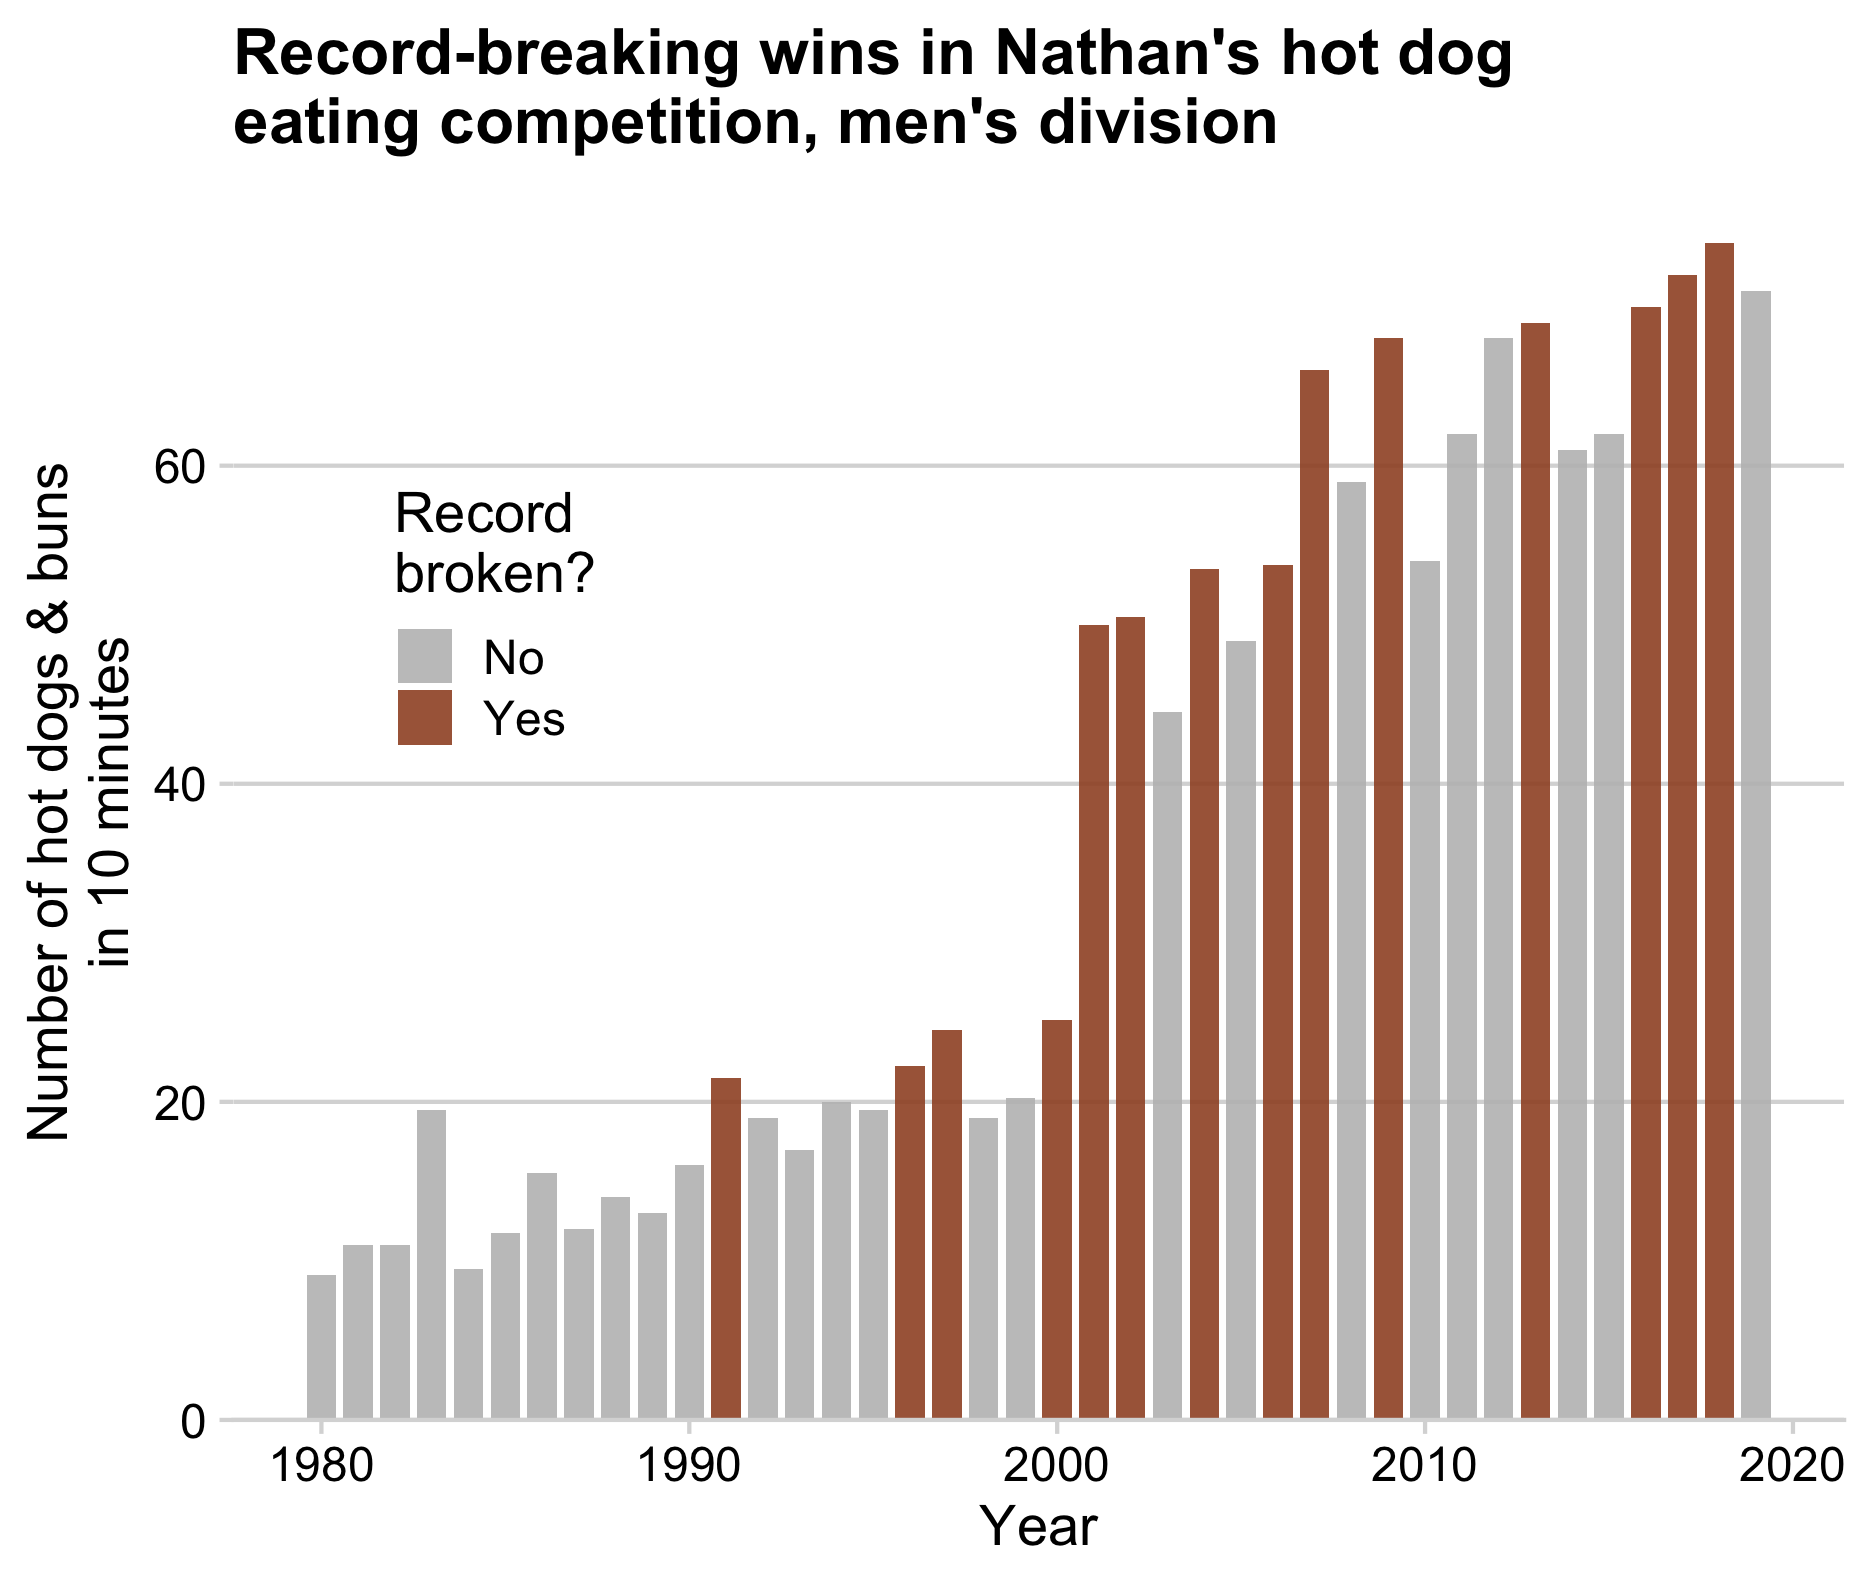
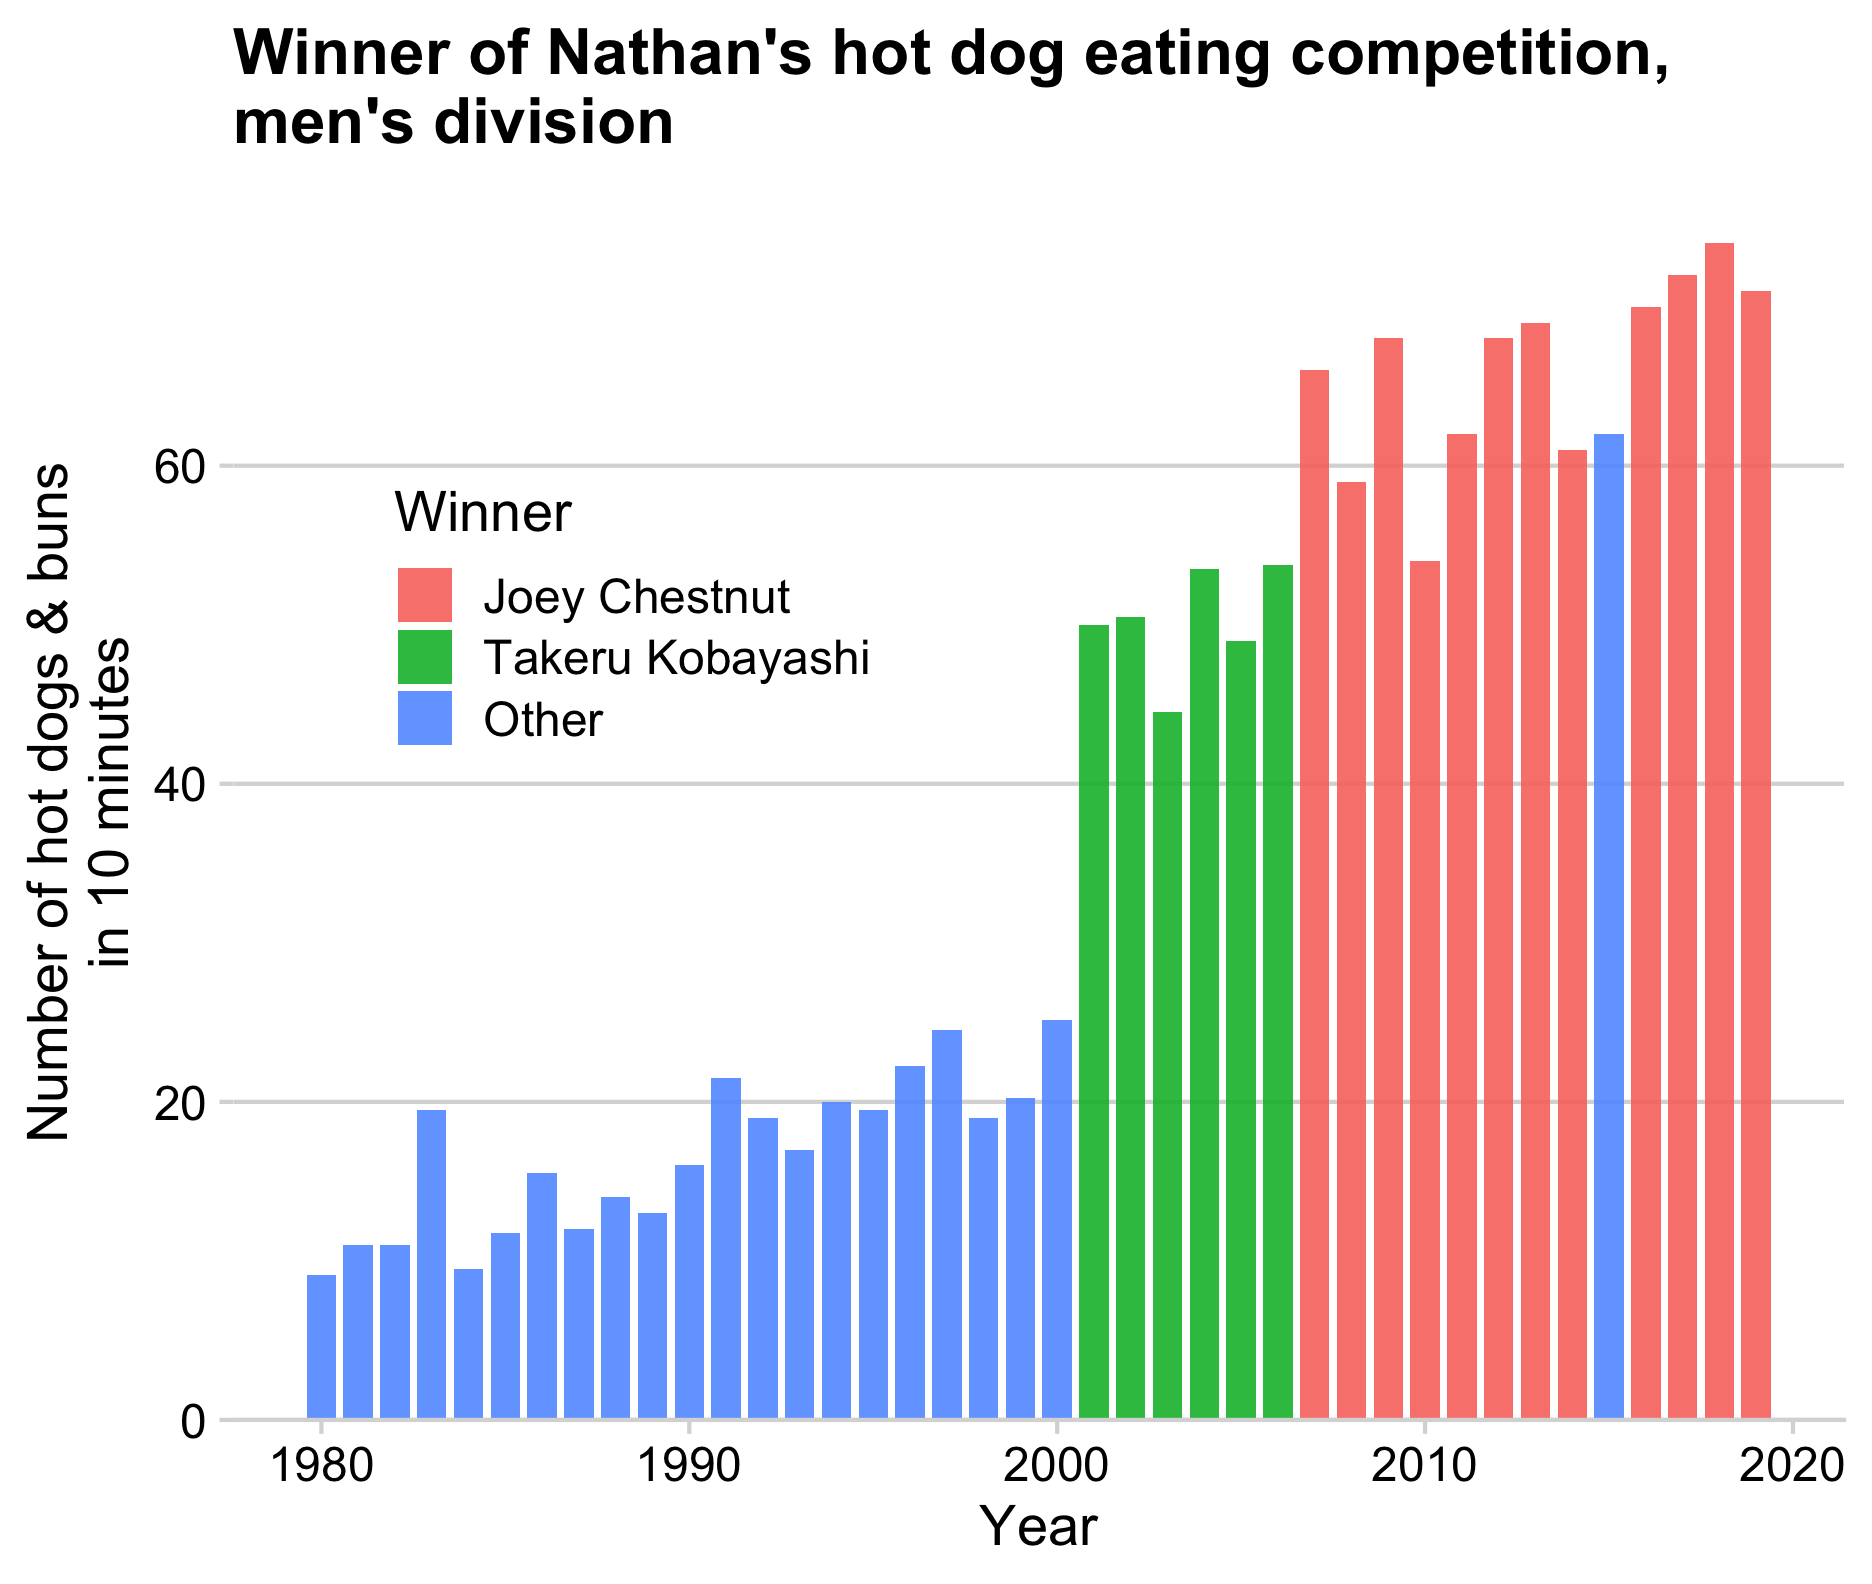
Bars are useful when emphasizing the data points
rather than the slope between them
How to: Points + line
Be sure to draw the line first,
then overlay the points
How to: Line + area
Likewise, draw the area first then overlay the line
ggplot(milk_ca, aes(x = year, y = milk_produced)) +
    geom_area(fill = 'steelblue', alpha = 0.5) +
    geom_line(color = 'steelblue', size = 1) +
    scale_y_continuous(
        expand = expansion(mult = c(0, 0.05))
    ) +
    theme_half_open(font_size = 18) +
    labs(
        x = 'Year',
        y = 'Milk produced (billion lbs)',
        title = 'Milk production in California'
    )
How to: Smoothed line + points
Use alpha to make points slightly transparent
Static chart
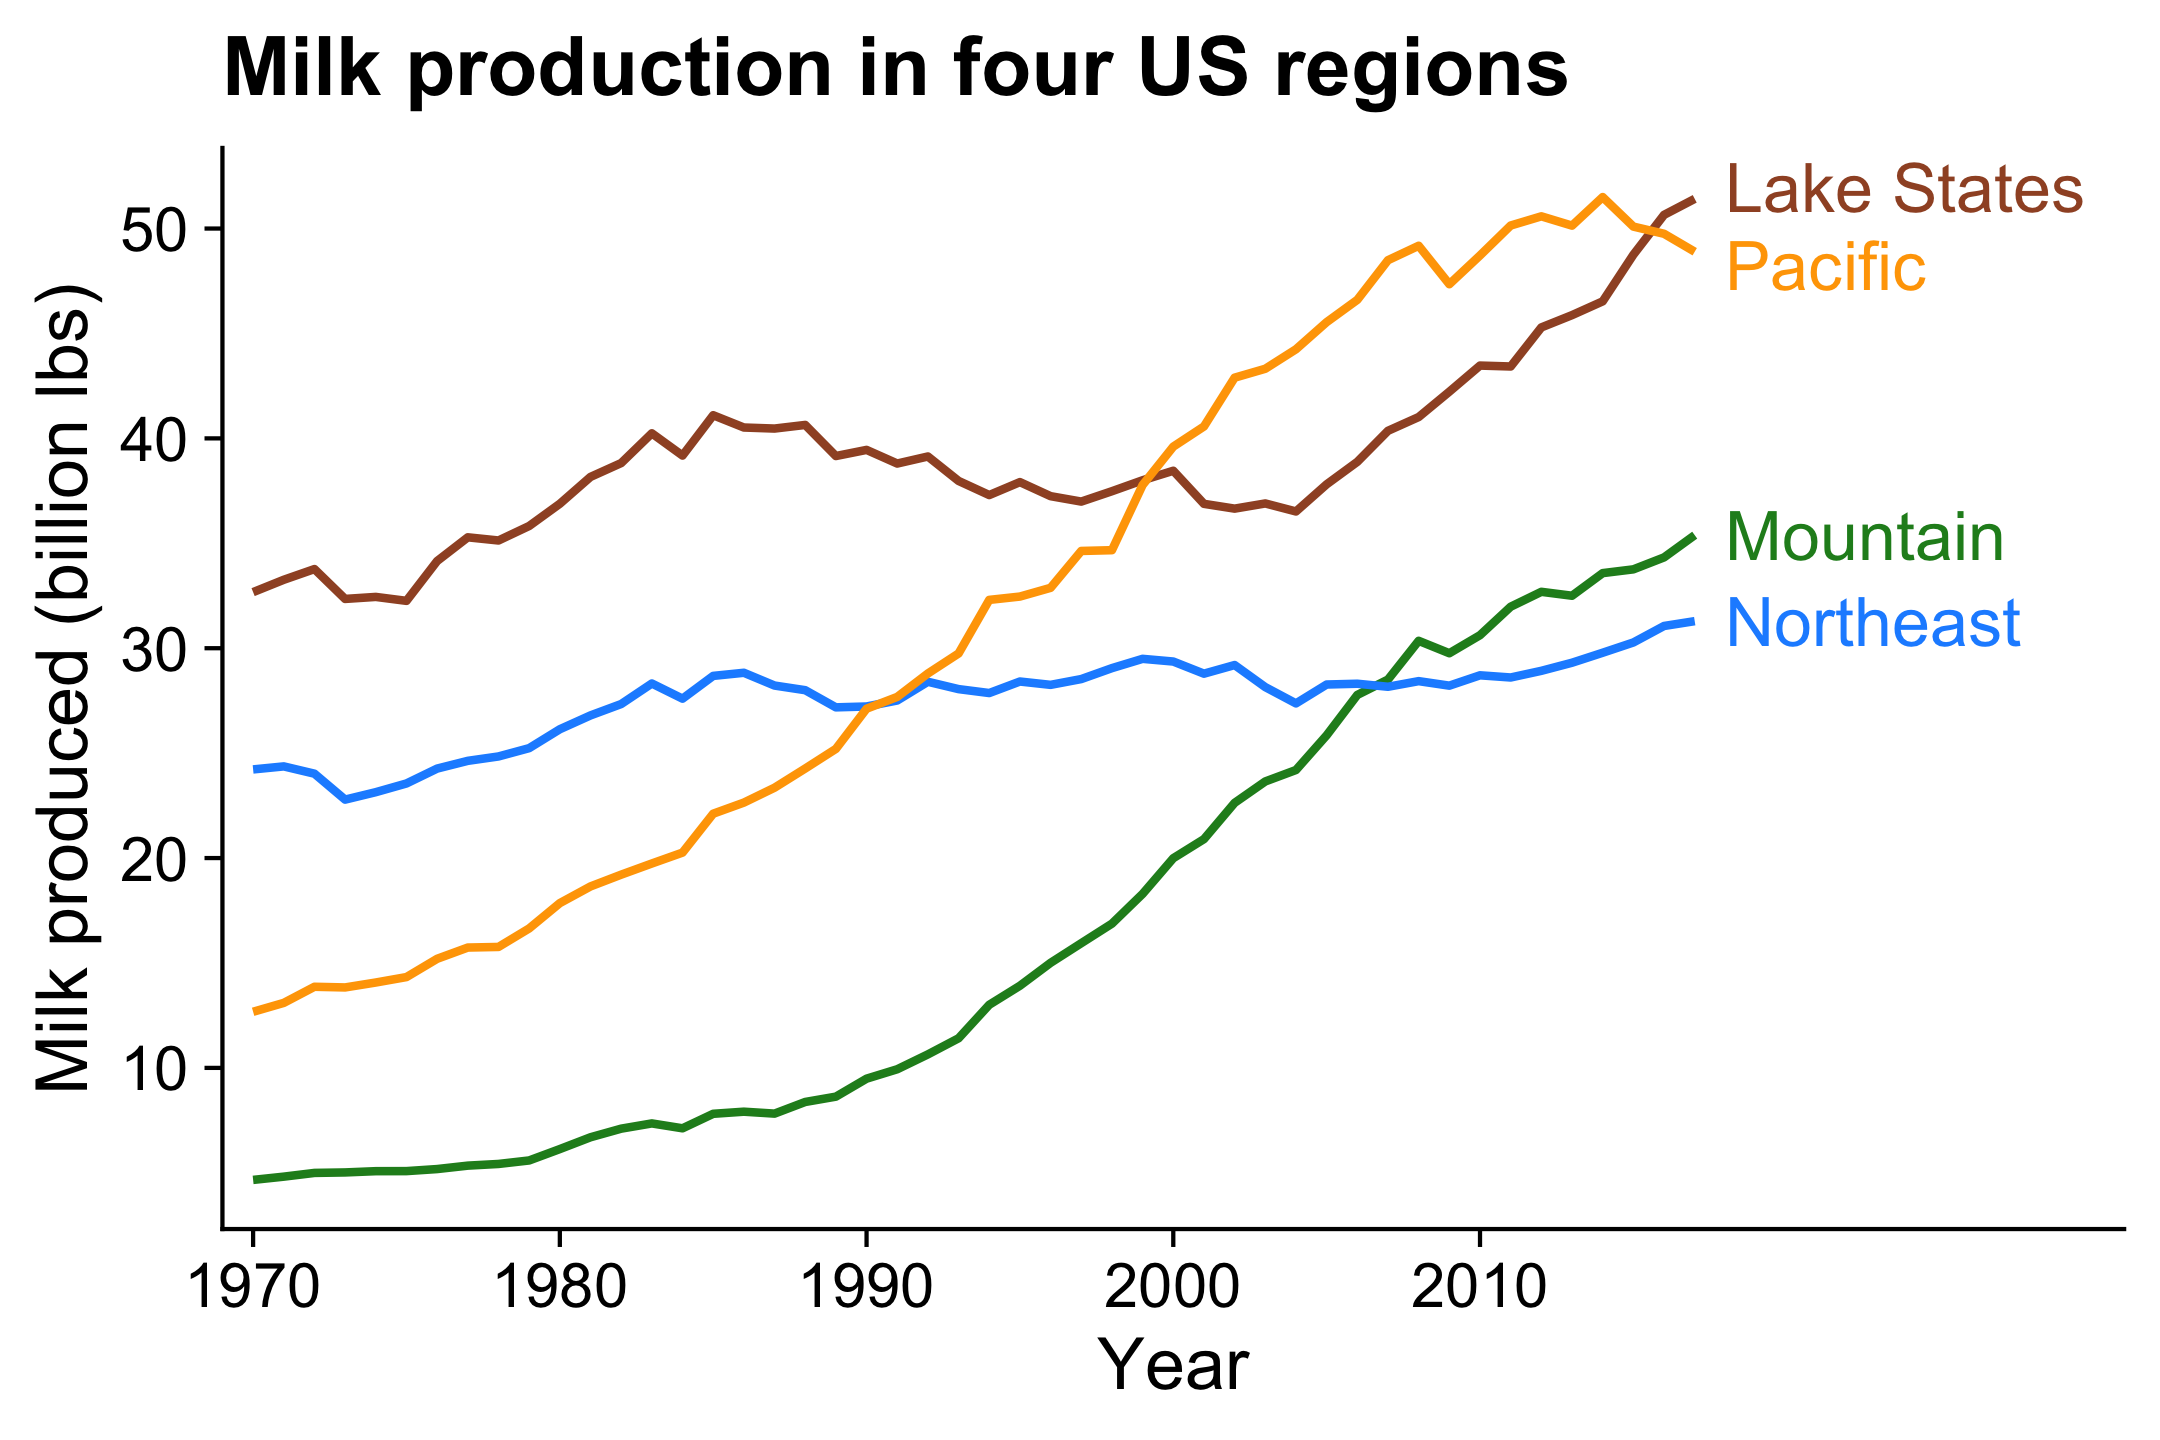
Animated chart

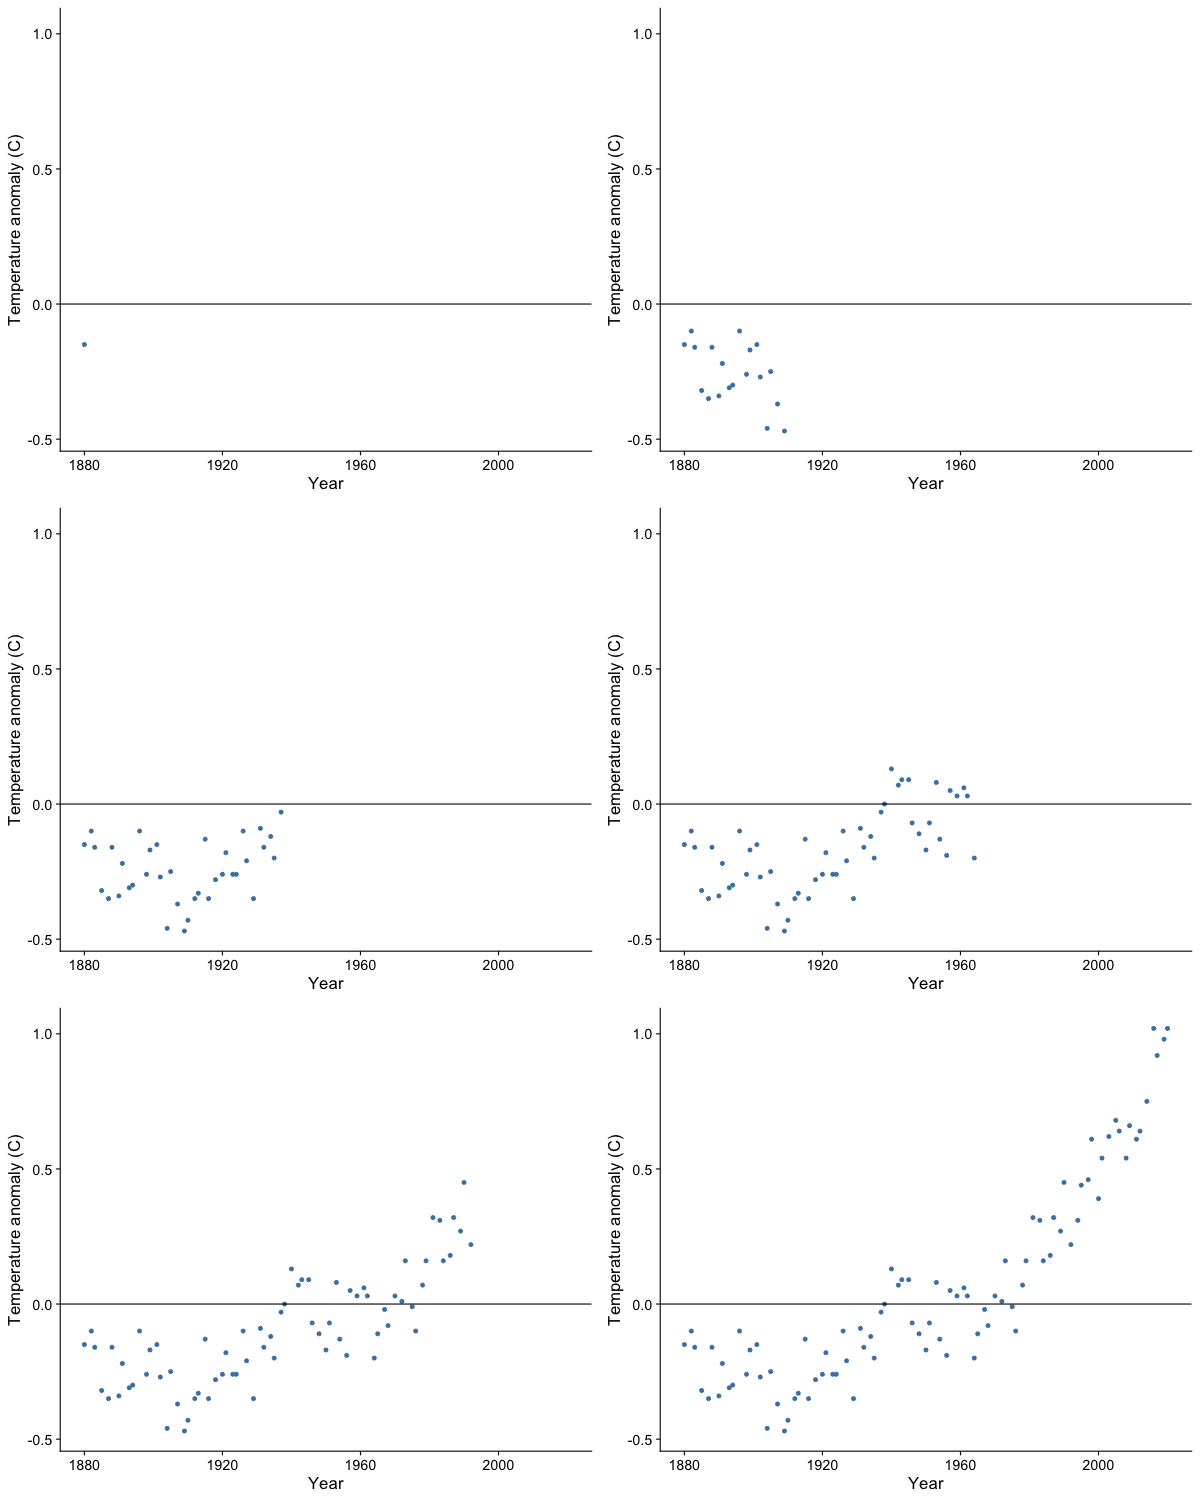
Animation is particularly helpful for the time dimension
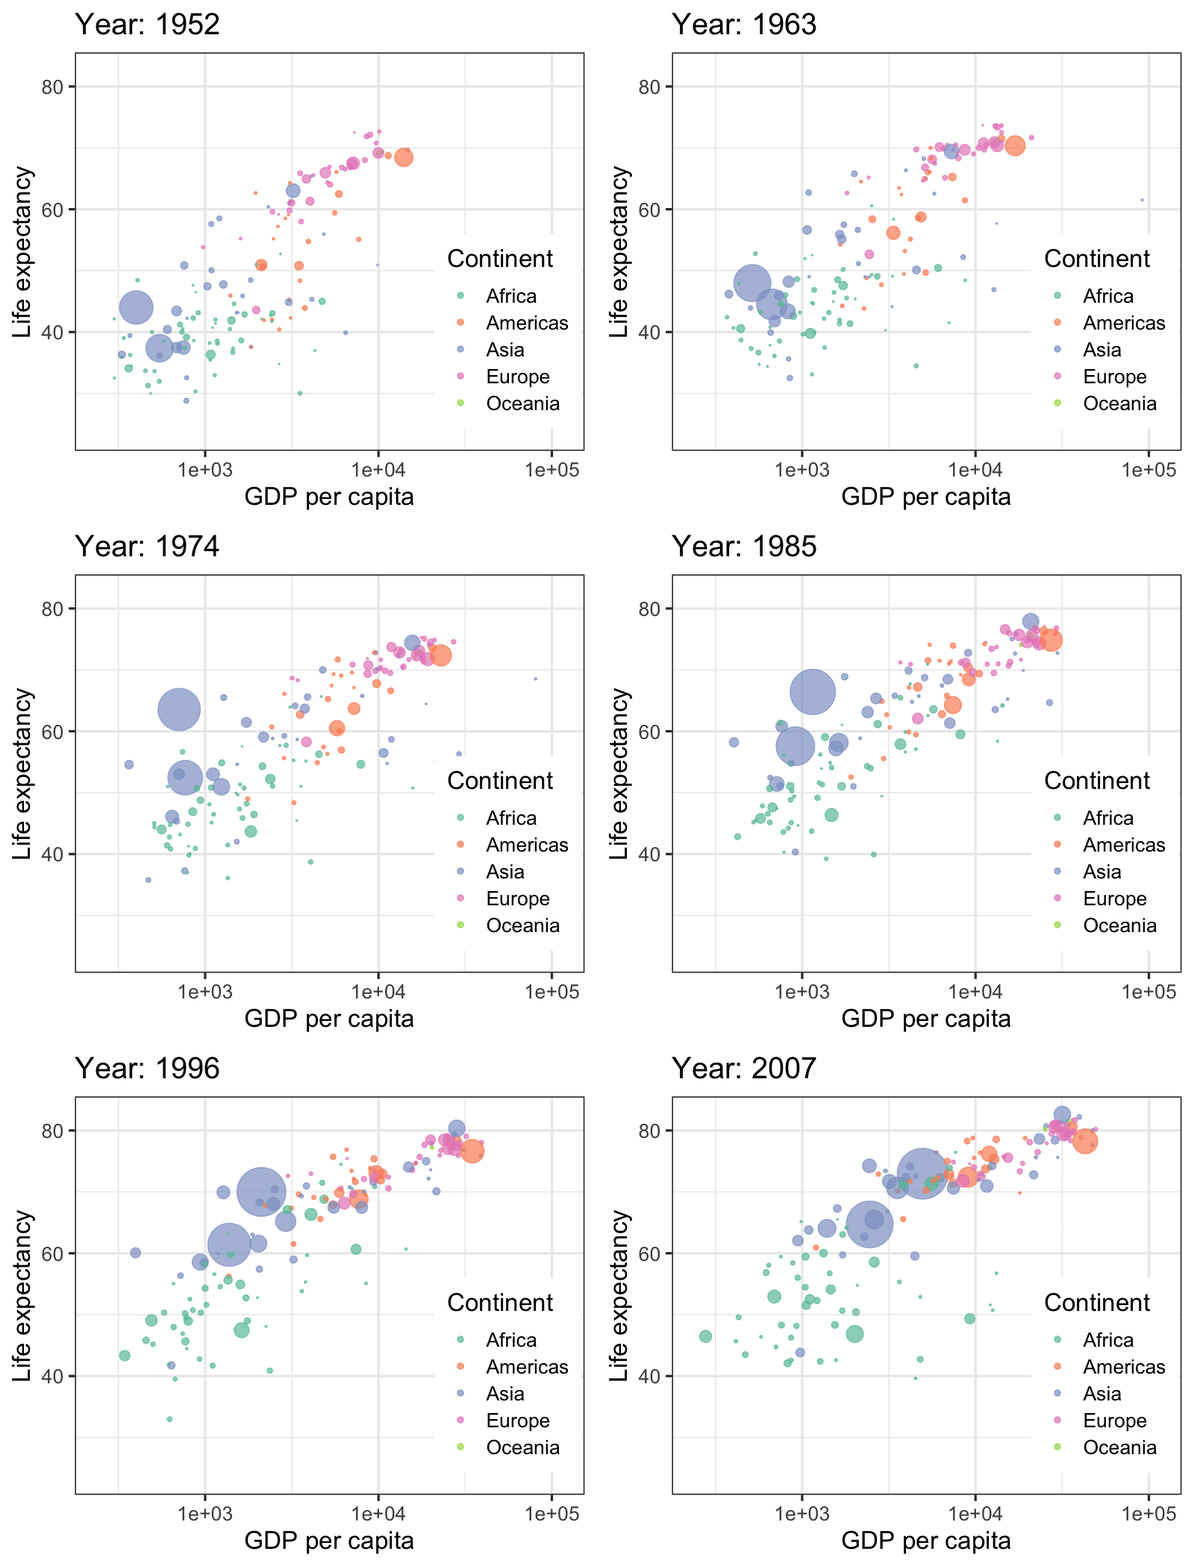
“Gapminder” visualization by Hans Rosling
Animation is particularly helpful for the time dimension
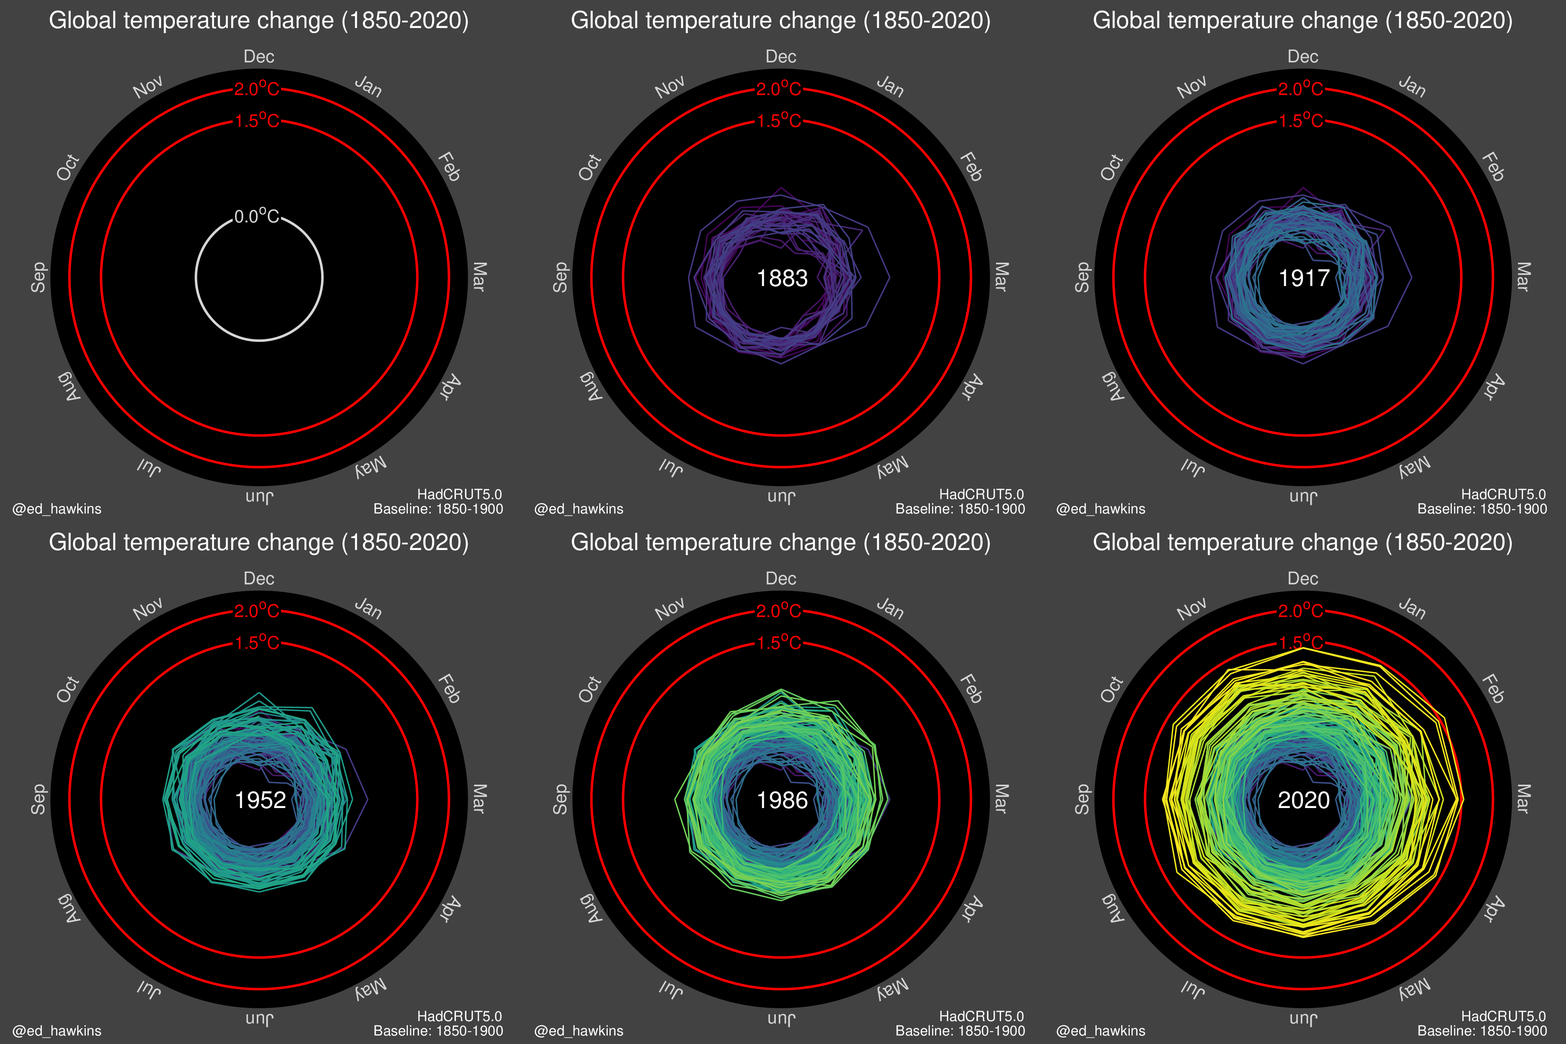
Animation is particularly helpful for the time dimension
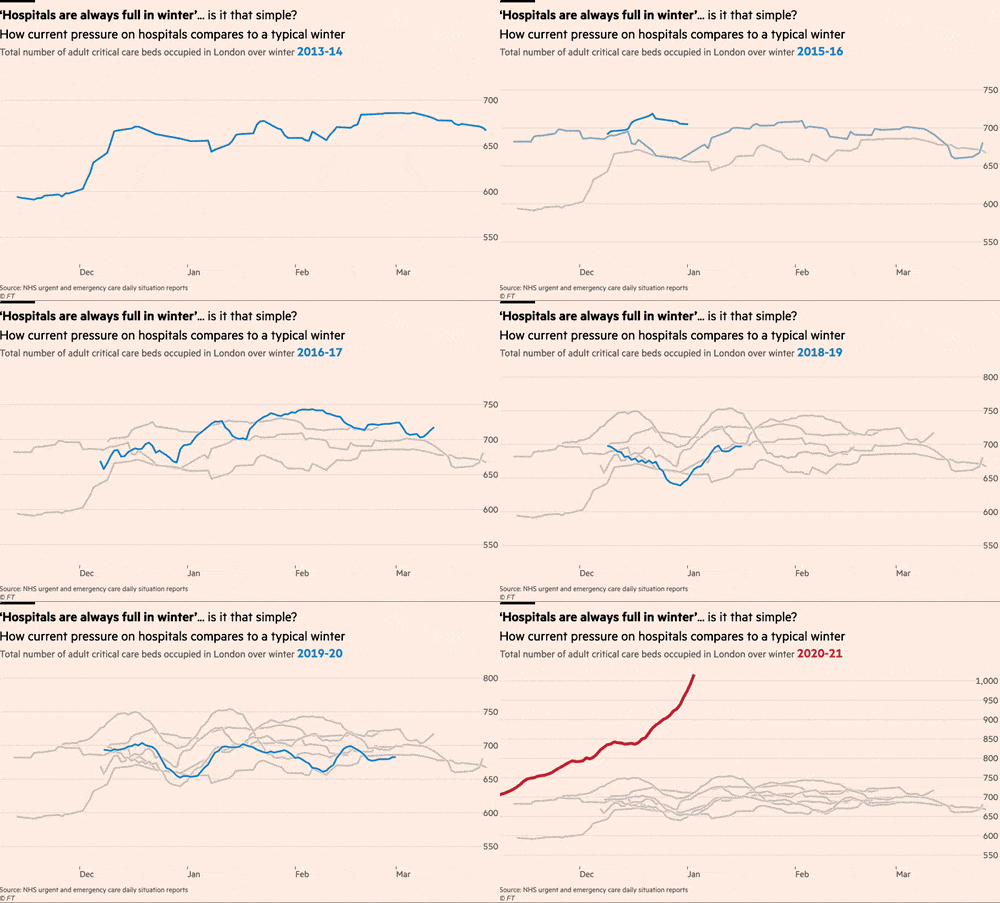
Financial Times comparison of Flu seasons to COVID-19
Animation is particularly helpful for the time dimension

“Bar chart race” of top 10 milk producing states
How to: Animate a line plot
Make a static plot w/labels for each year
milk_region_anim_plot <- milk_region %>%
  ggplot(aes(x = year, y = milk_produced, color = region)) +
  geom_line(size = 1) +
  geom_point(size = 2) +
  geom_text_repel(
    aes(label = region),
    hjust = 0,
    nudge_x = 1,
    direction = "y",
    size = 6,
    segment.color = NA
  ) +
  scale_x_continuous(
    breaks = seq(1970, 2010, 10),
    expand = expansion(add = c(1, 13))
  ) +
  scale_color_manual(
    values = c('sienna', 'forestgreen', 'dodgerblue', 'orange')
  ) +
  theme_half_open(font_size = 18) +
  theme(legend.position = 'none') +
  labs(
    x = 'Year',
    y = 'Milk produced (billion lbs)',
    title = 'Milk production in four US regions'
  )

milk_region_anim_plot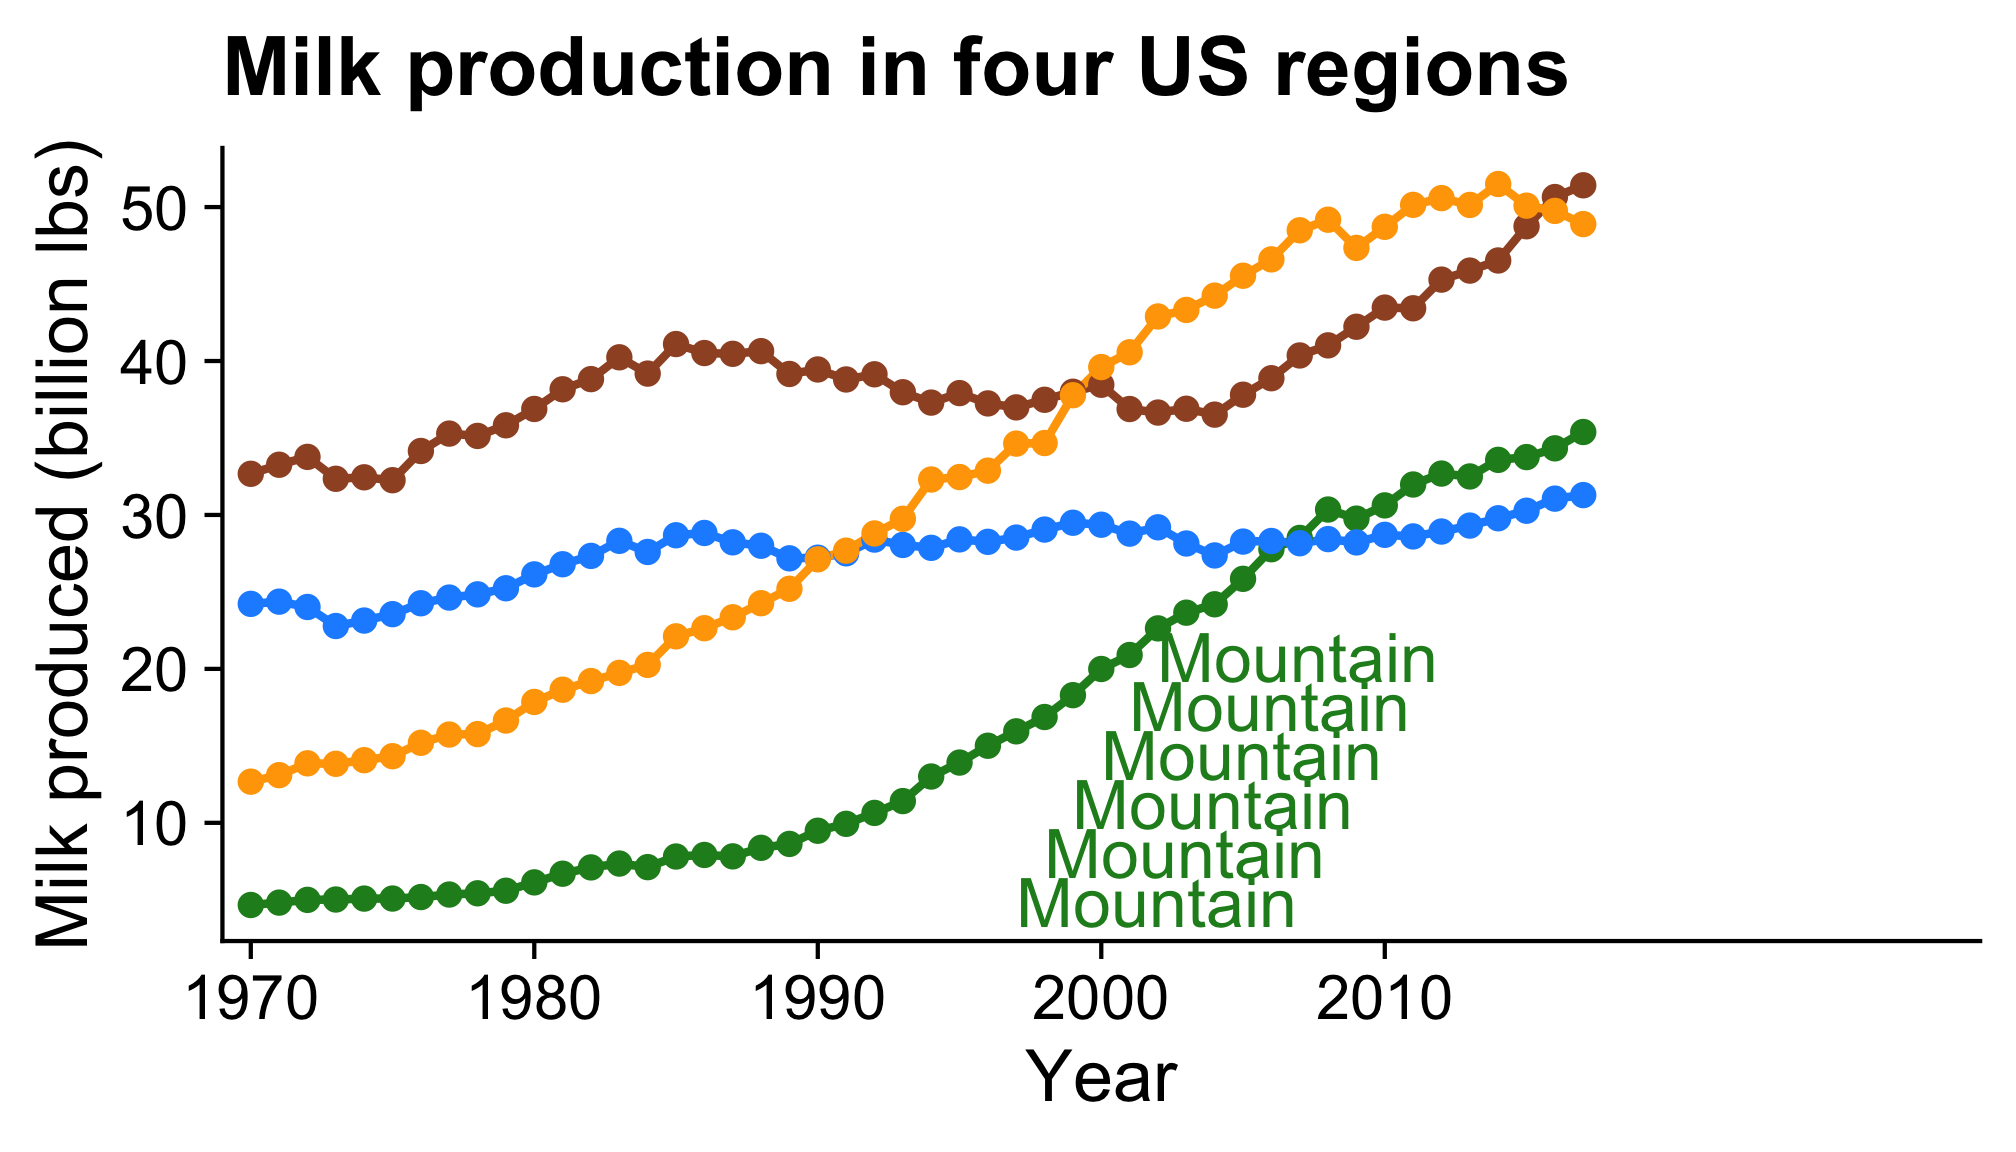
How to: Animate a line plot
Now animate it
Note the pause at the end!
library(gganimate)

milk_region_anim <- milk_region_anim_plot +
    transition_reveal(year)

# Render the animation
animate(
    milk_region_anim,
    end_pause = 15,
    duration = 10,
    width = 1100,
    height = 650,
    res = 150,
    renderer = magick_renderer()
)

# Save last animation
anim_save(file.path(
    'figs',
    'milk_region_animation.gif'
))
How to: Change label based on year
First make a static plot
gapminder_anim_plot <- ggplot(
  gapminder,
  aes(x = gdpPercap, y = lifeExp, size = pop, color = continent)
) +
  geom_point(alpha = 0.7) +
  scale_size_area(guide = FALSE, max_size = 15) +
  scale_color_brewer(palette = 'Set2') +
  scale_x_log10() +
  theme_bw(base_size = 18) +
  theme(legend.position = c(0.85, 0.3)) +
  labs(x = 'GDP per capita', y = 'Life expectancy', color = 'Continent')

gapminder_anim_plot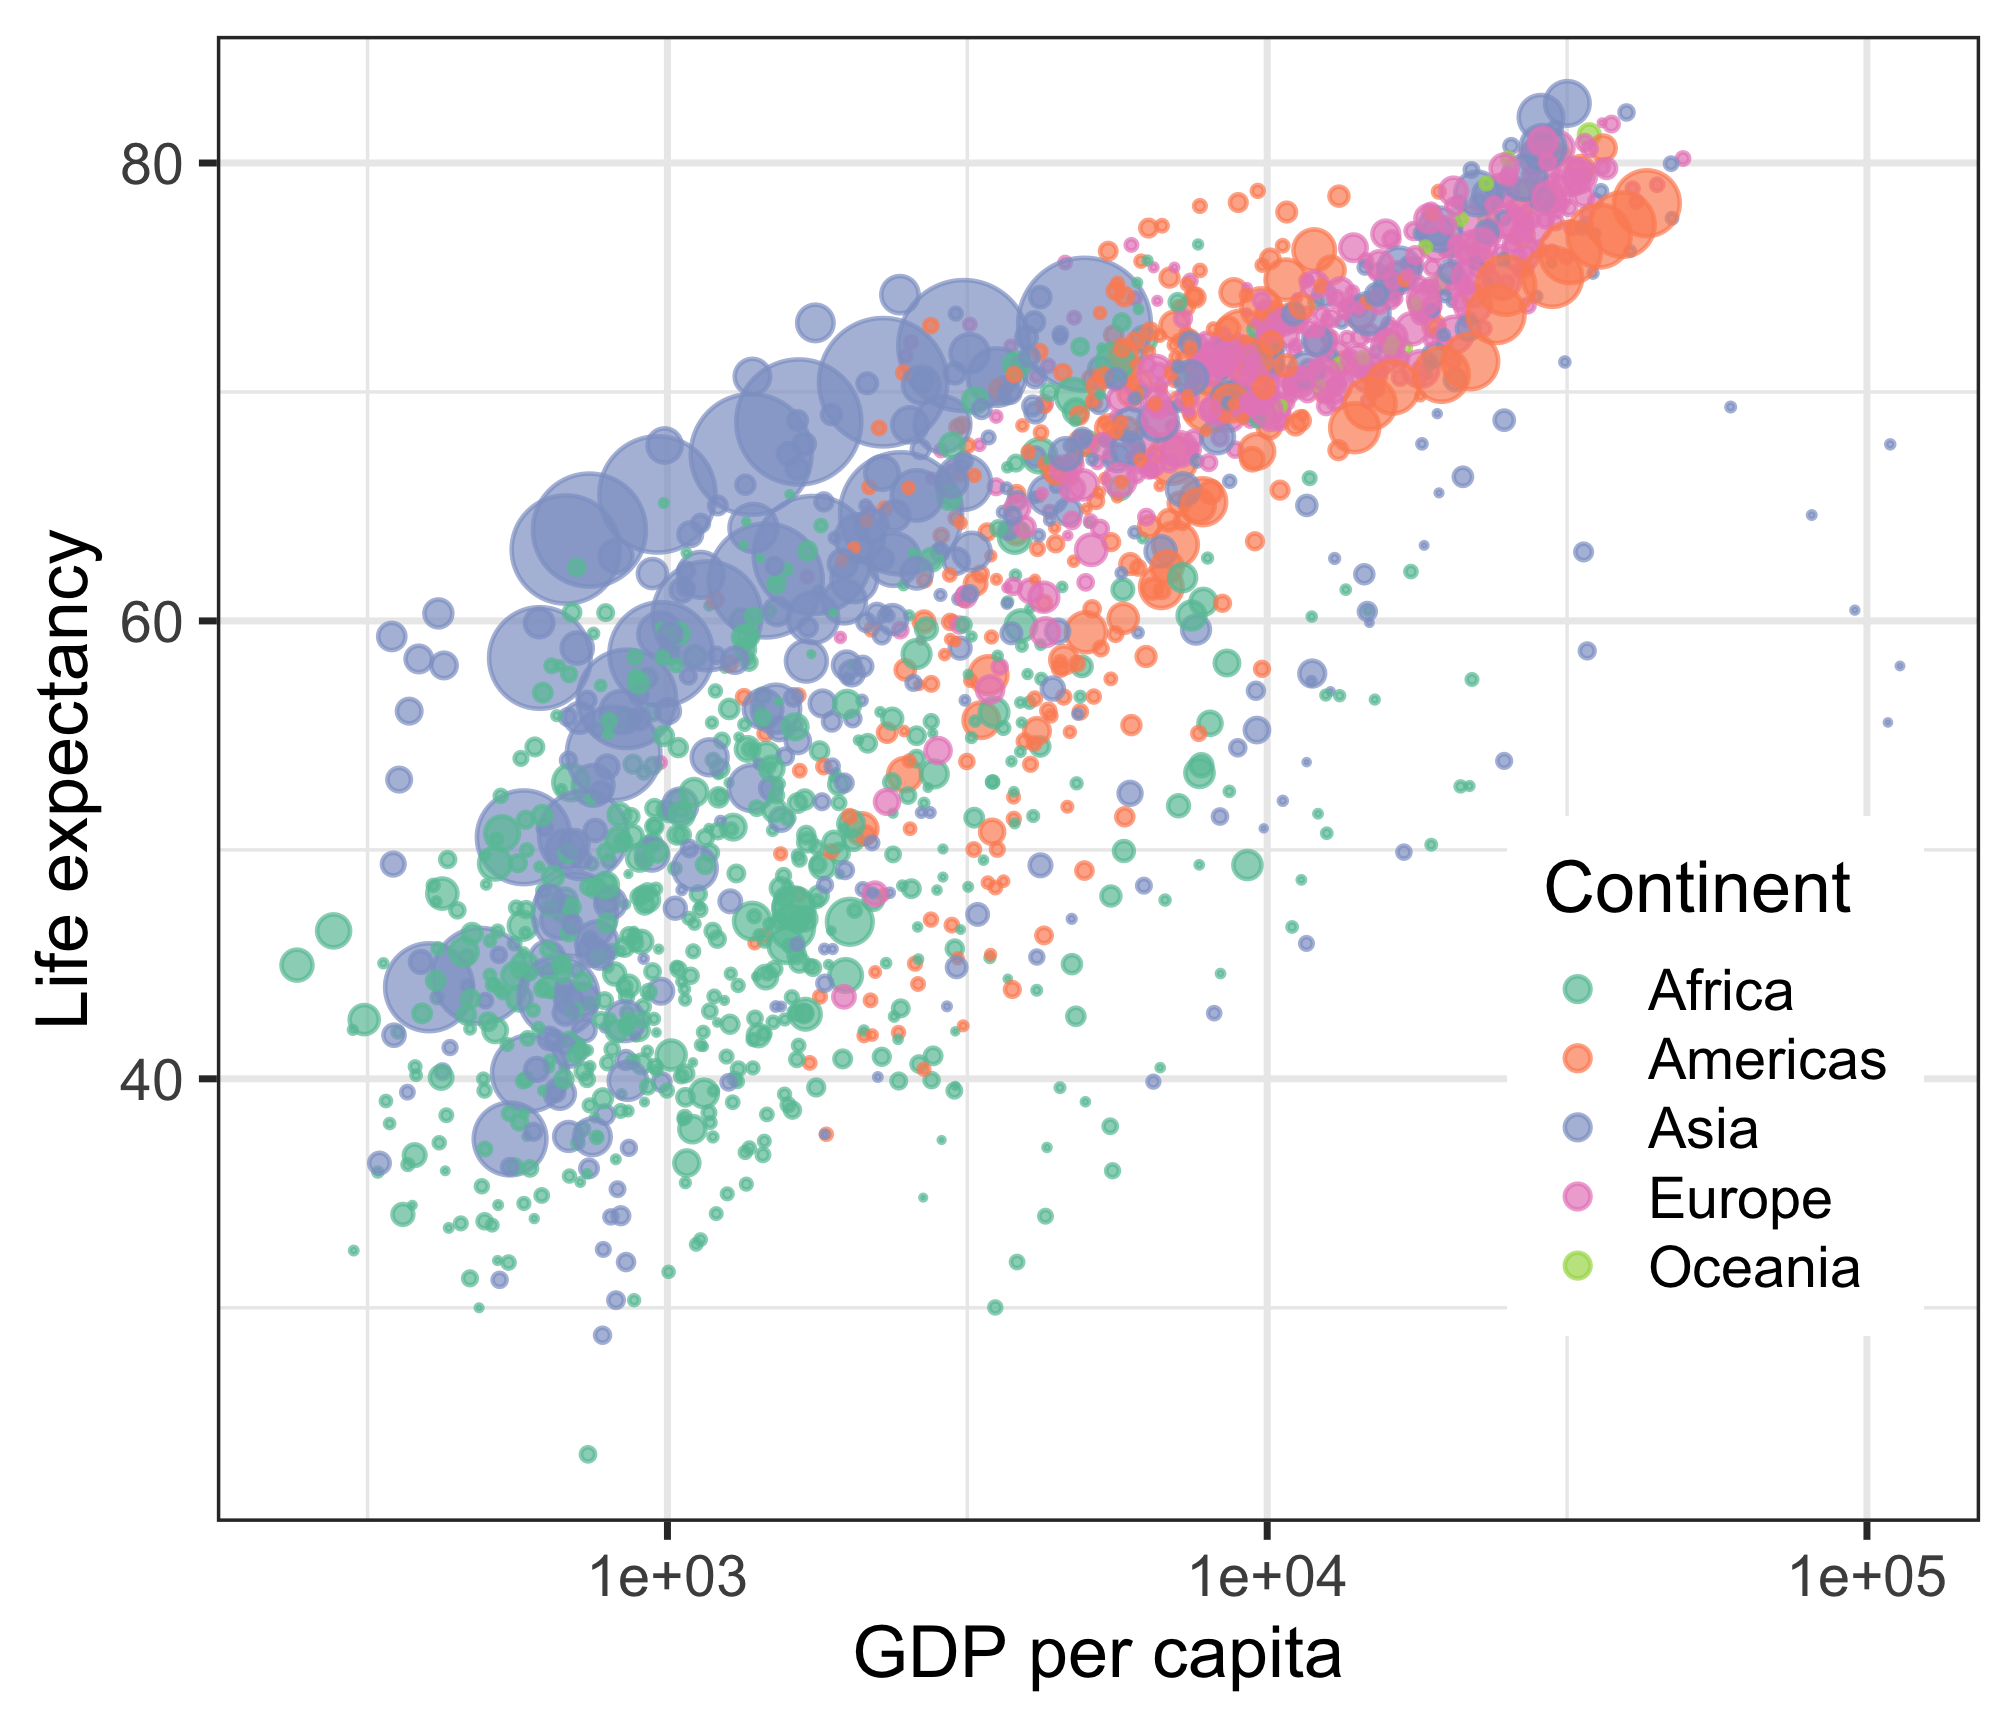
How to: Change label based on year
milk_race_anim <- milk_production %>%
  group_by(year) %>%
  mutate(
    rank = rank(-milk_produced),
    Value_rel = milk_produced / milk_produced[rank == 1],
    Value_lbl = paste0(' ', round(milk_produced))
  ) %>%
  group_by(state) %>%
  filter(rank <= 10) %>%
  ungroup() %>%
  mutate(year = as.integer(year)) %>%
  ggplot(aes(x = rank, group = state, fill = region, color = region)) +
  geom_tile(
    aes(y = milk_produced / 2, height = milk_produced),
    width = 0.9,
    alpha = 0.8,
    color = NA
  ) +
  geom_text(aes(y = 0, label = paste(state, " ")), vjust = 0.2, hjust = 1) +
  geom_text(aes(y = milk_produced, label = Value_lbl), hjust = 0) +
  coord_flip(clip = 'off', expand = FALSE) +
  scale_y_continuous(labels = scales::comma) +
  scale_fill_viridis(discrete = TRUE) +
  scale_color_viridis(discrete = TRUE) +
  scale_x_reverse() +
  guides(color = FALSE) +
  theme_minimal_vgrid() +
  transition_time(year) +
  view_follow(fixed_x = TRUE) +
  theme(
    axis.line = element_blank(),
    axis.text = element_blank(),
    axis.ticks = element_blank(),
    axis.title = element_blank(),
    legend.position = c(0.7, 0.3),
    legend.background = element_rect(fill = 'white'),
    plot.title = element_text(
      size = 22,
      hjust = 0.5,
      face = 'bold',
      colour = 'grey',
      vjust = -1
    ),
    plot.subtitle = element_text(
      size = 18,
      hjust = 0.5,
      face = 'italic',
      color = 'grey'
    ),
    plot.caption = element_text(
      size = 8,
      hjust = 0.5,
      face = 'italic',
      color = 'grey'
    ),
    plot.margin = margin(0.5, 2, 0.5, 3, 'cm')
  ) +
  labs(
    title = 'Year : {frame_time}',
    subtitle = 'Top 10 states by milk produced',
    fill = 'Region',
    caption = 'Milk produced (billions lbs)'
)Your turn
Use the global_temps data frame to explore ways to animate the change in average global temperatures.
Consider using:
- points
- lines
- areas
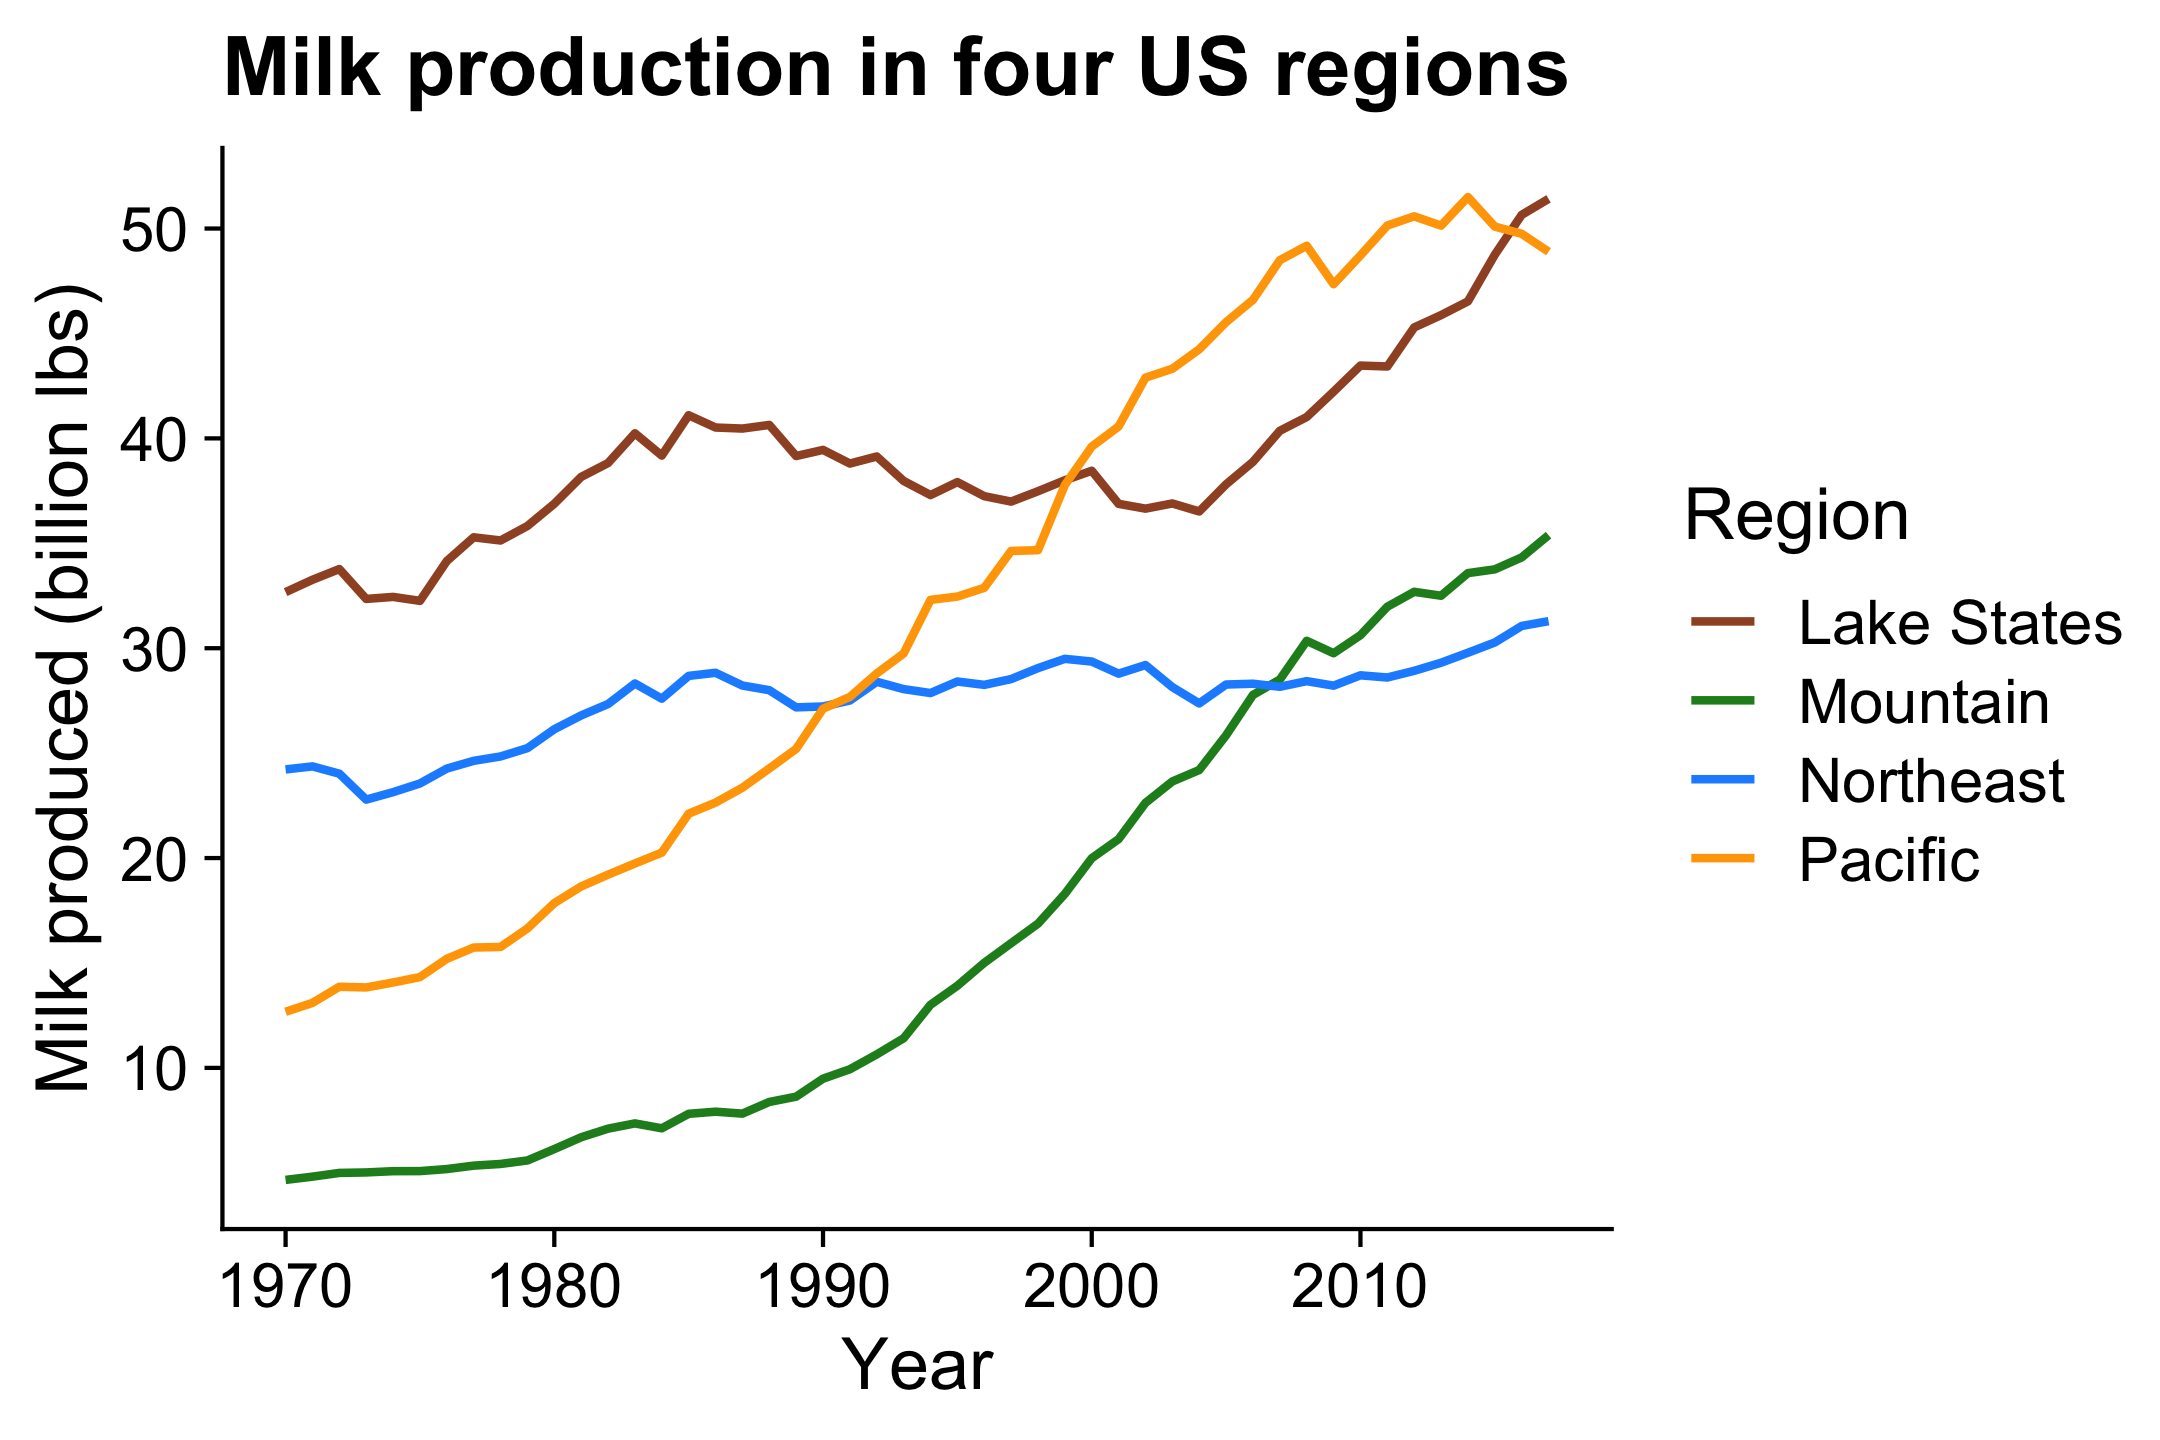
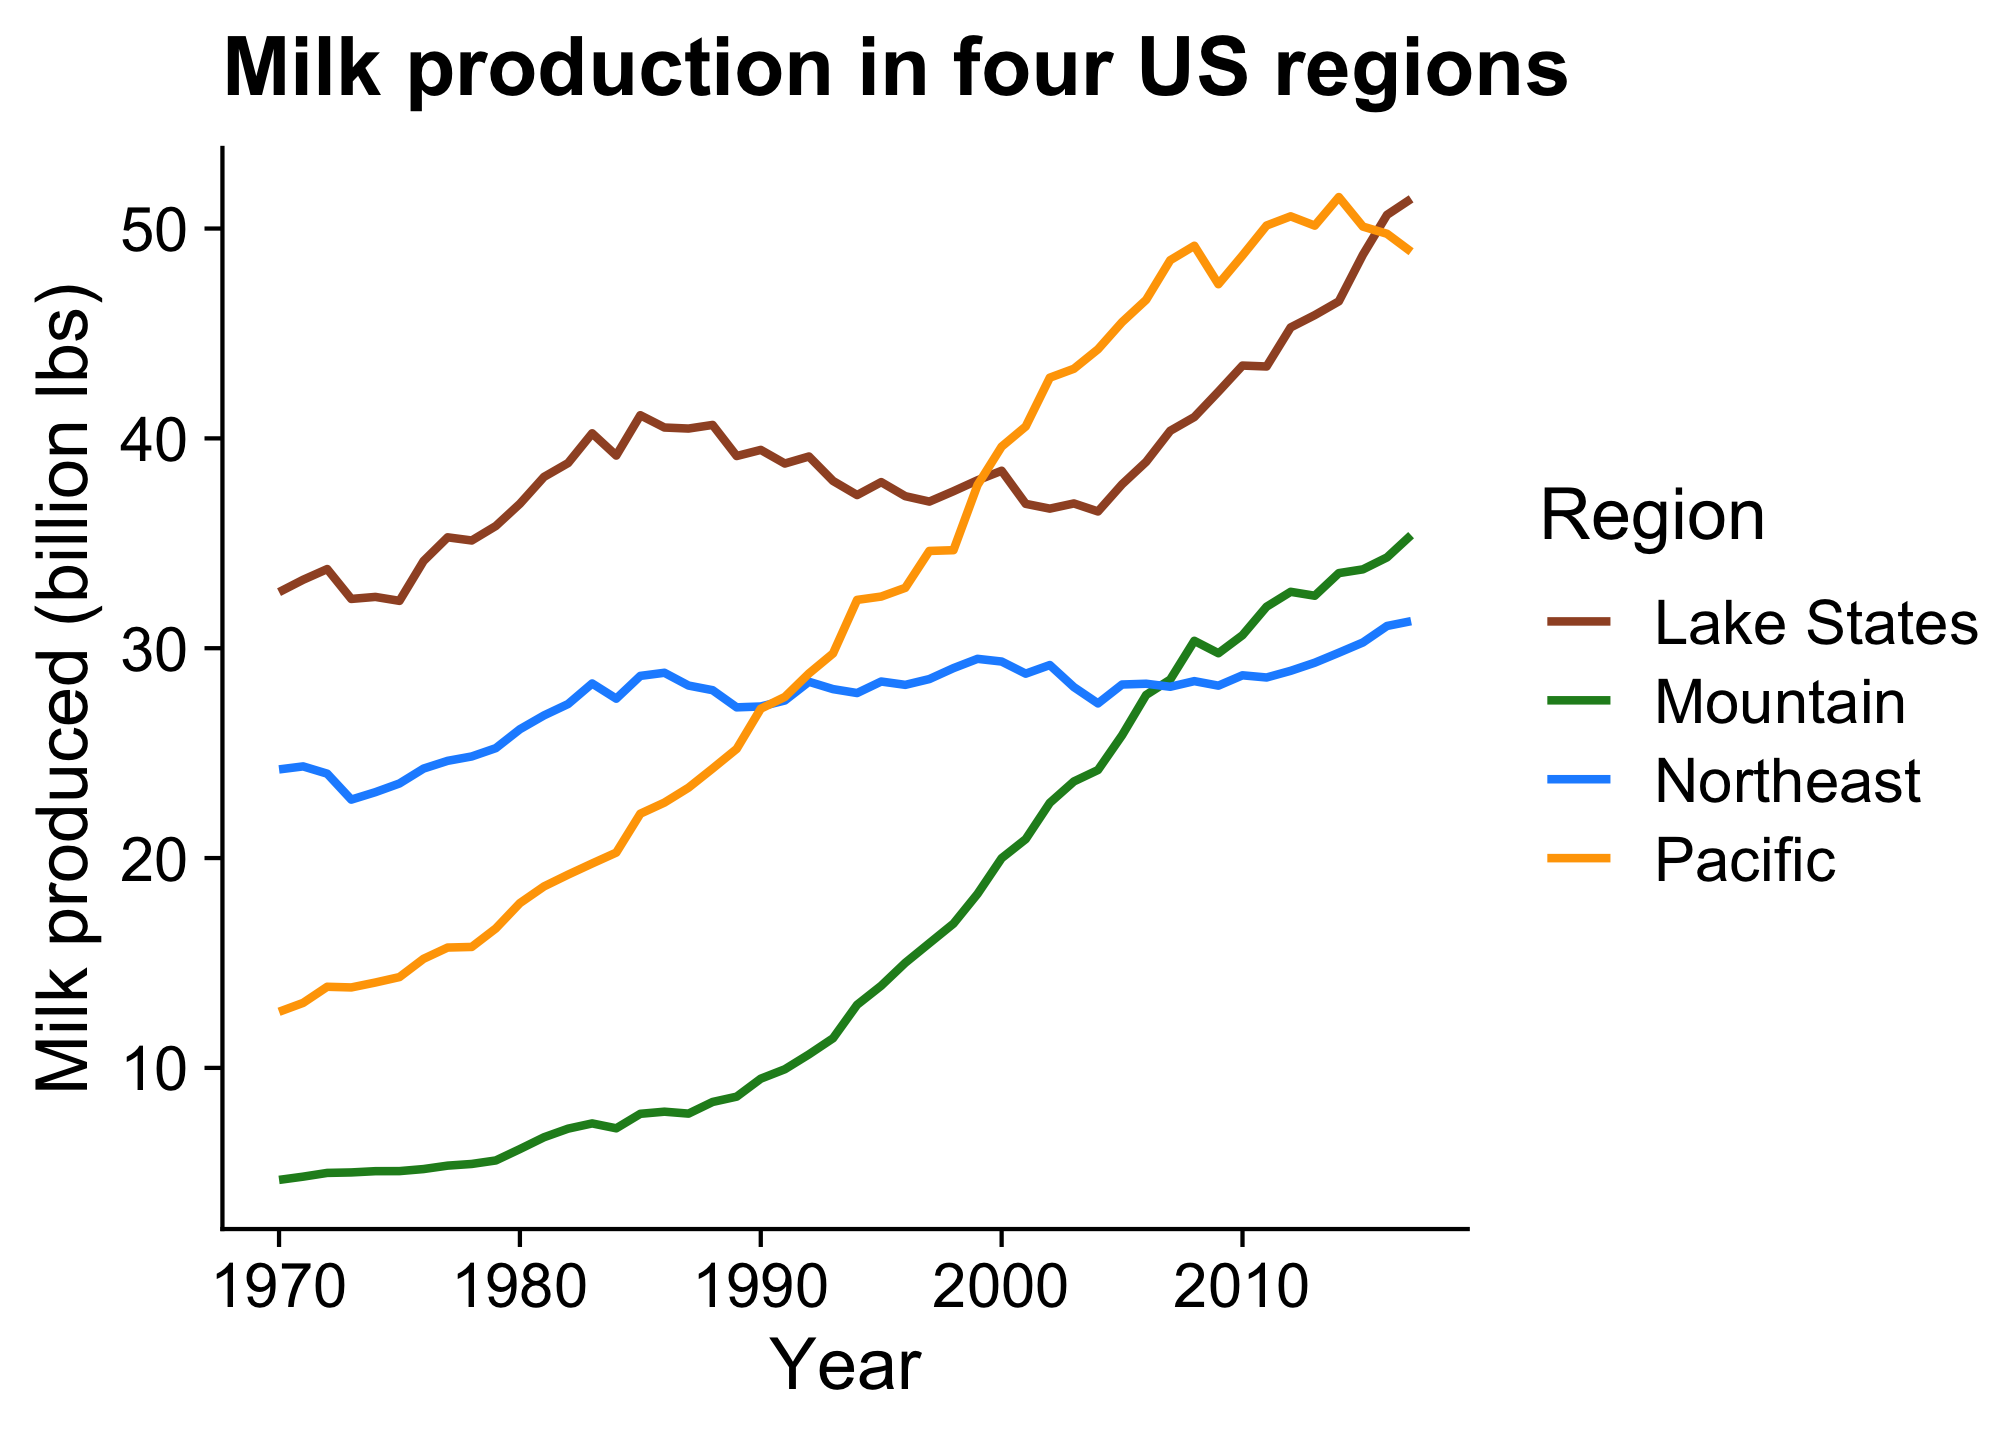
With multiple categories,
points & lines can get messy
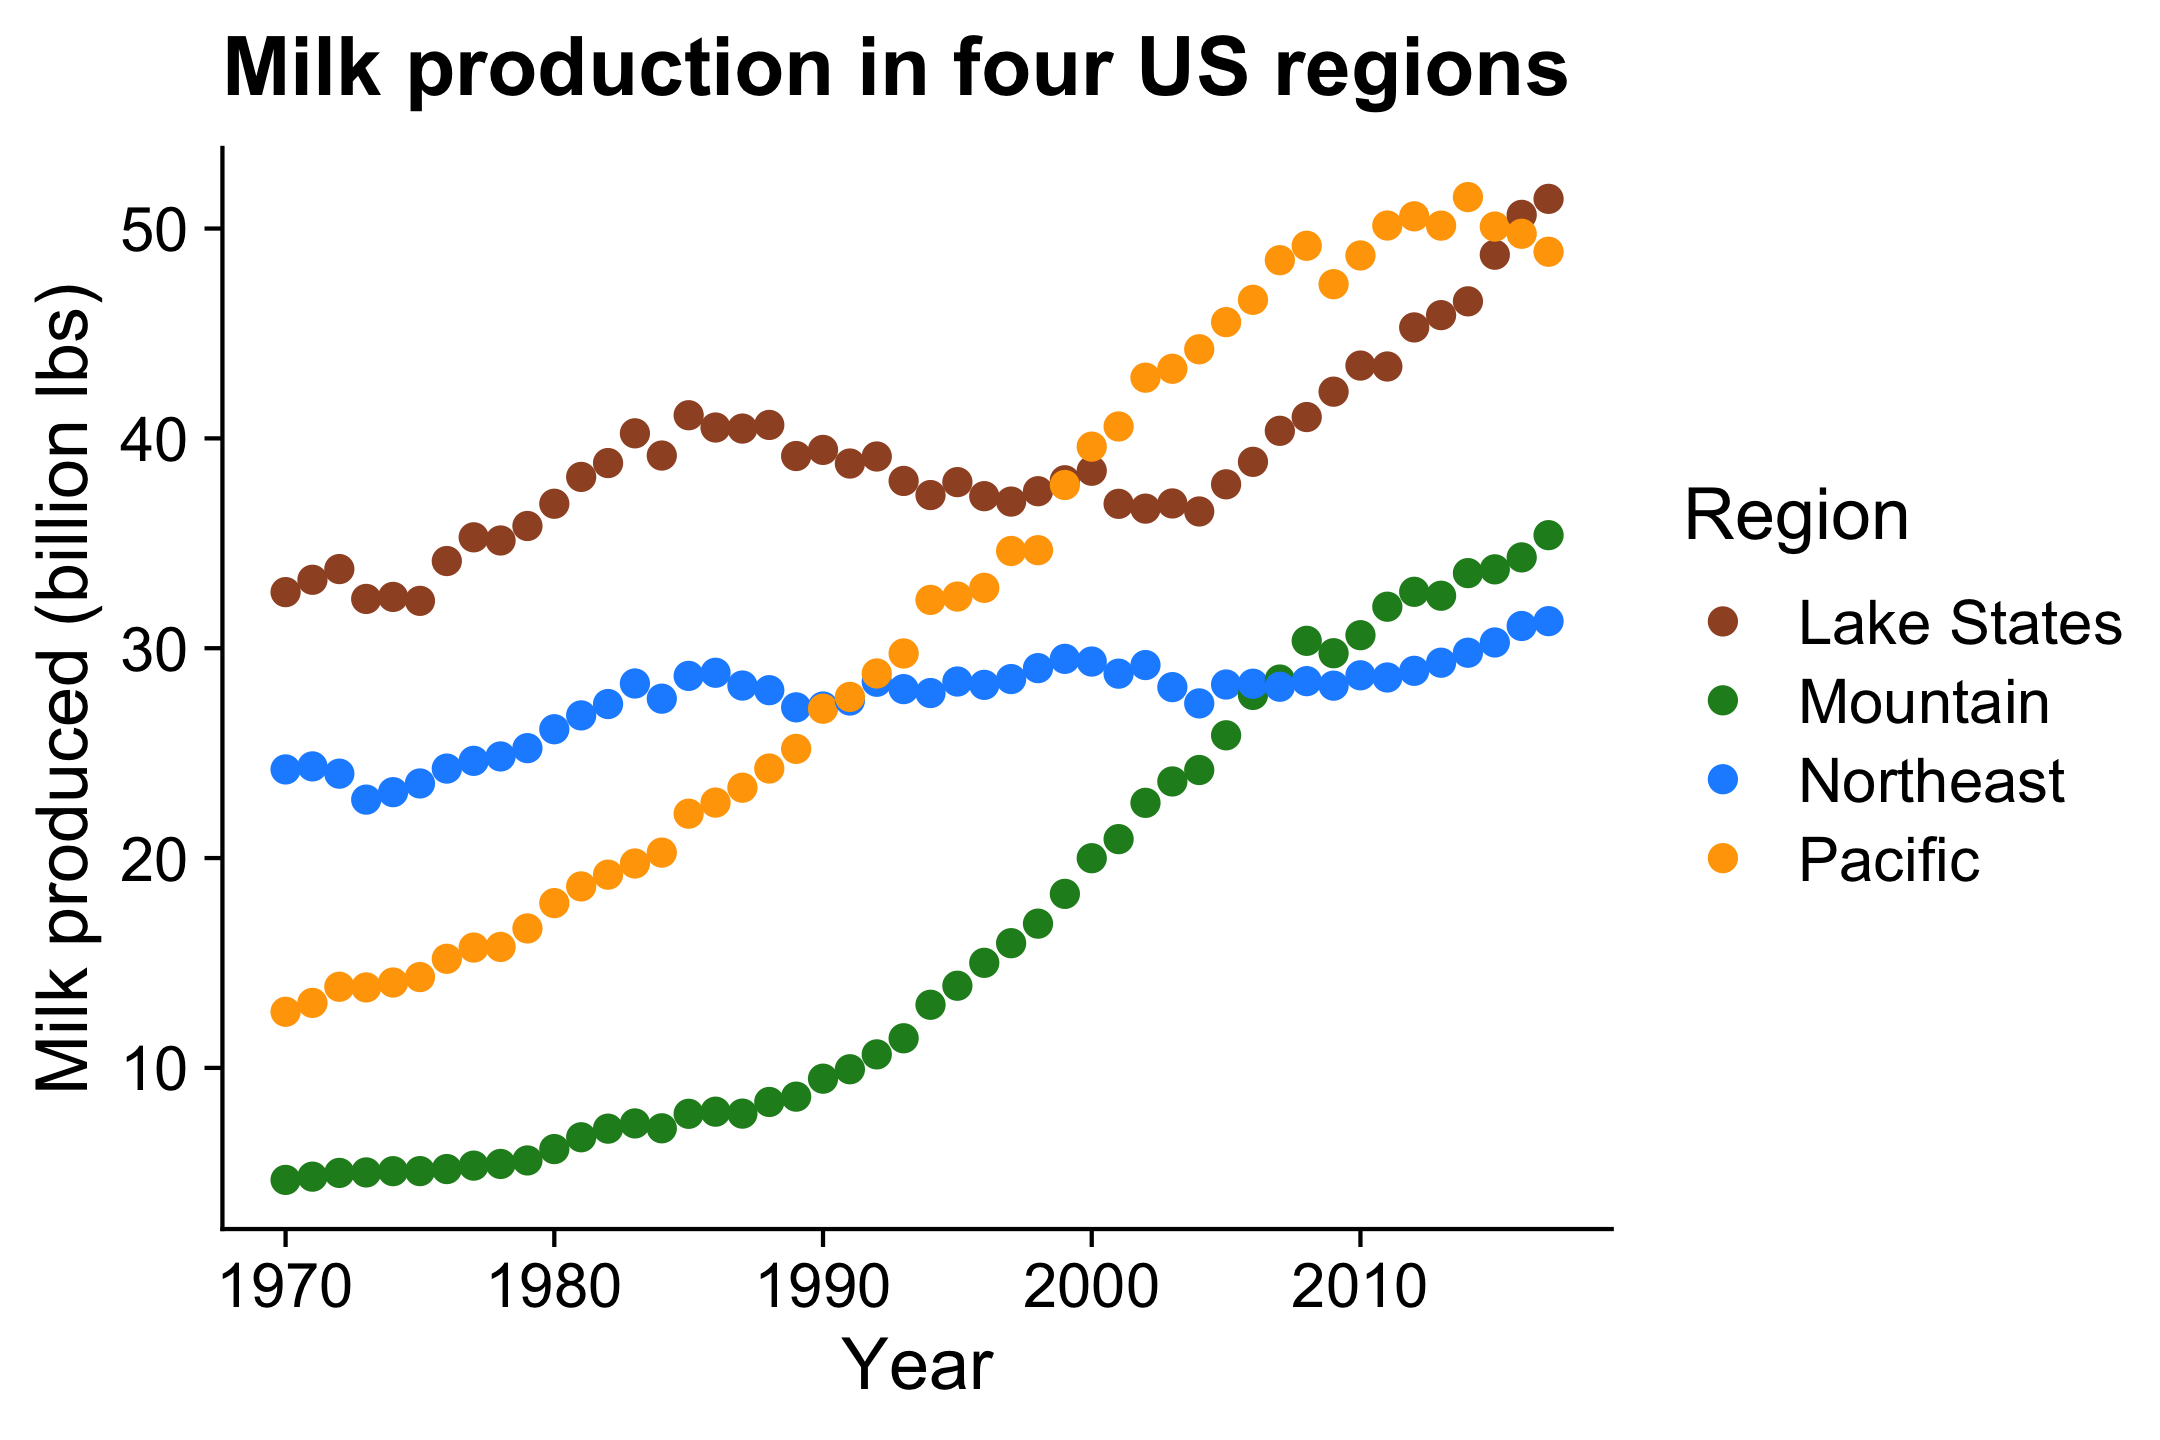

Better: Lines alone makes distinguishing trends easier
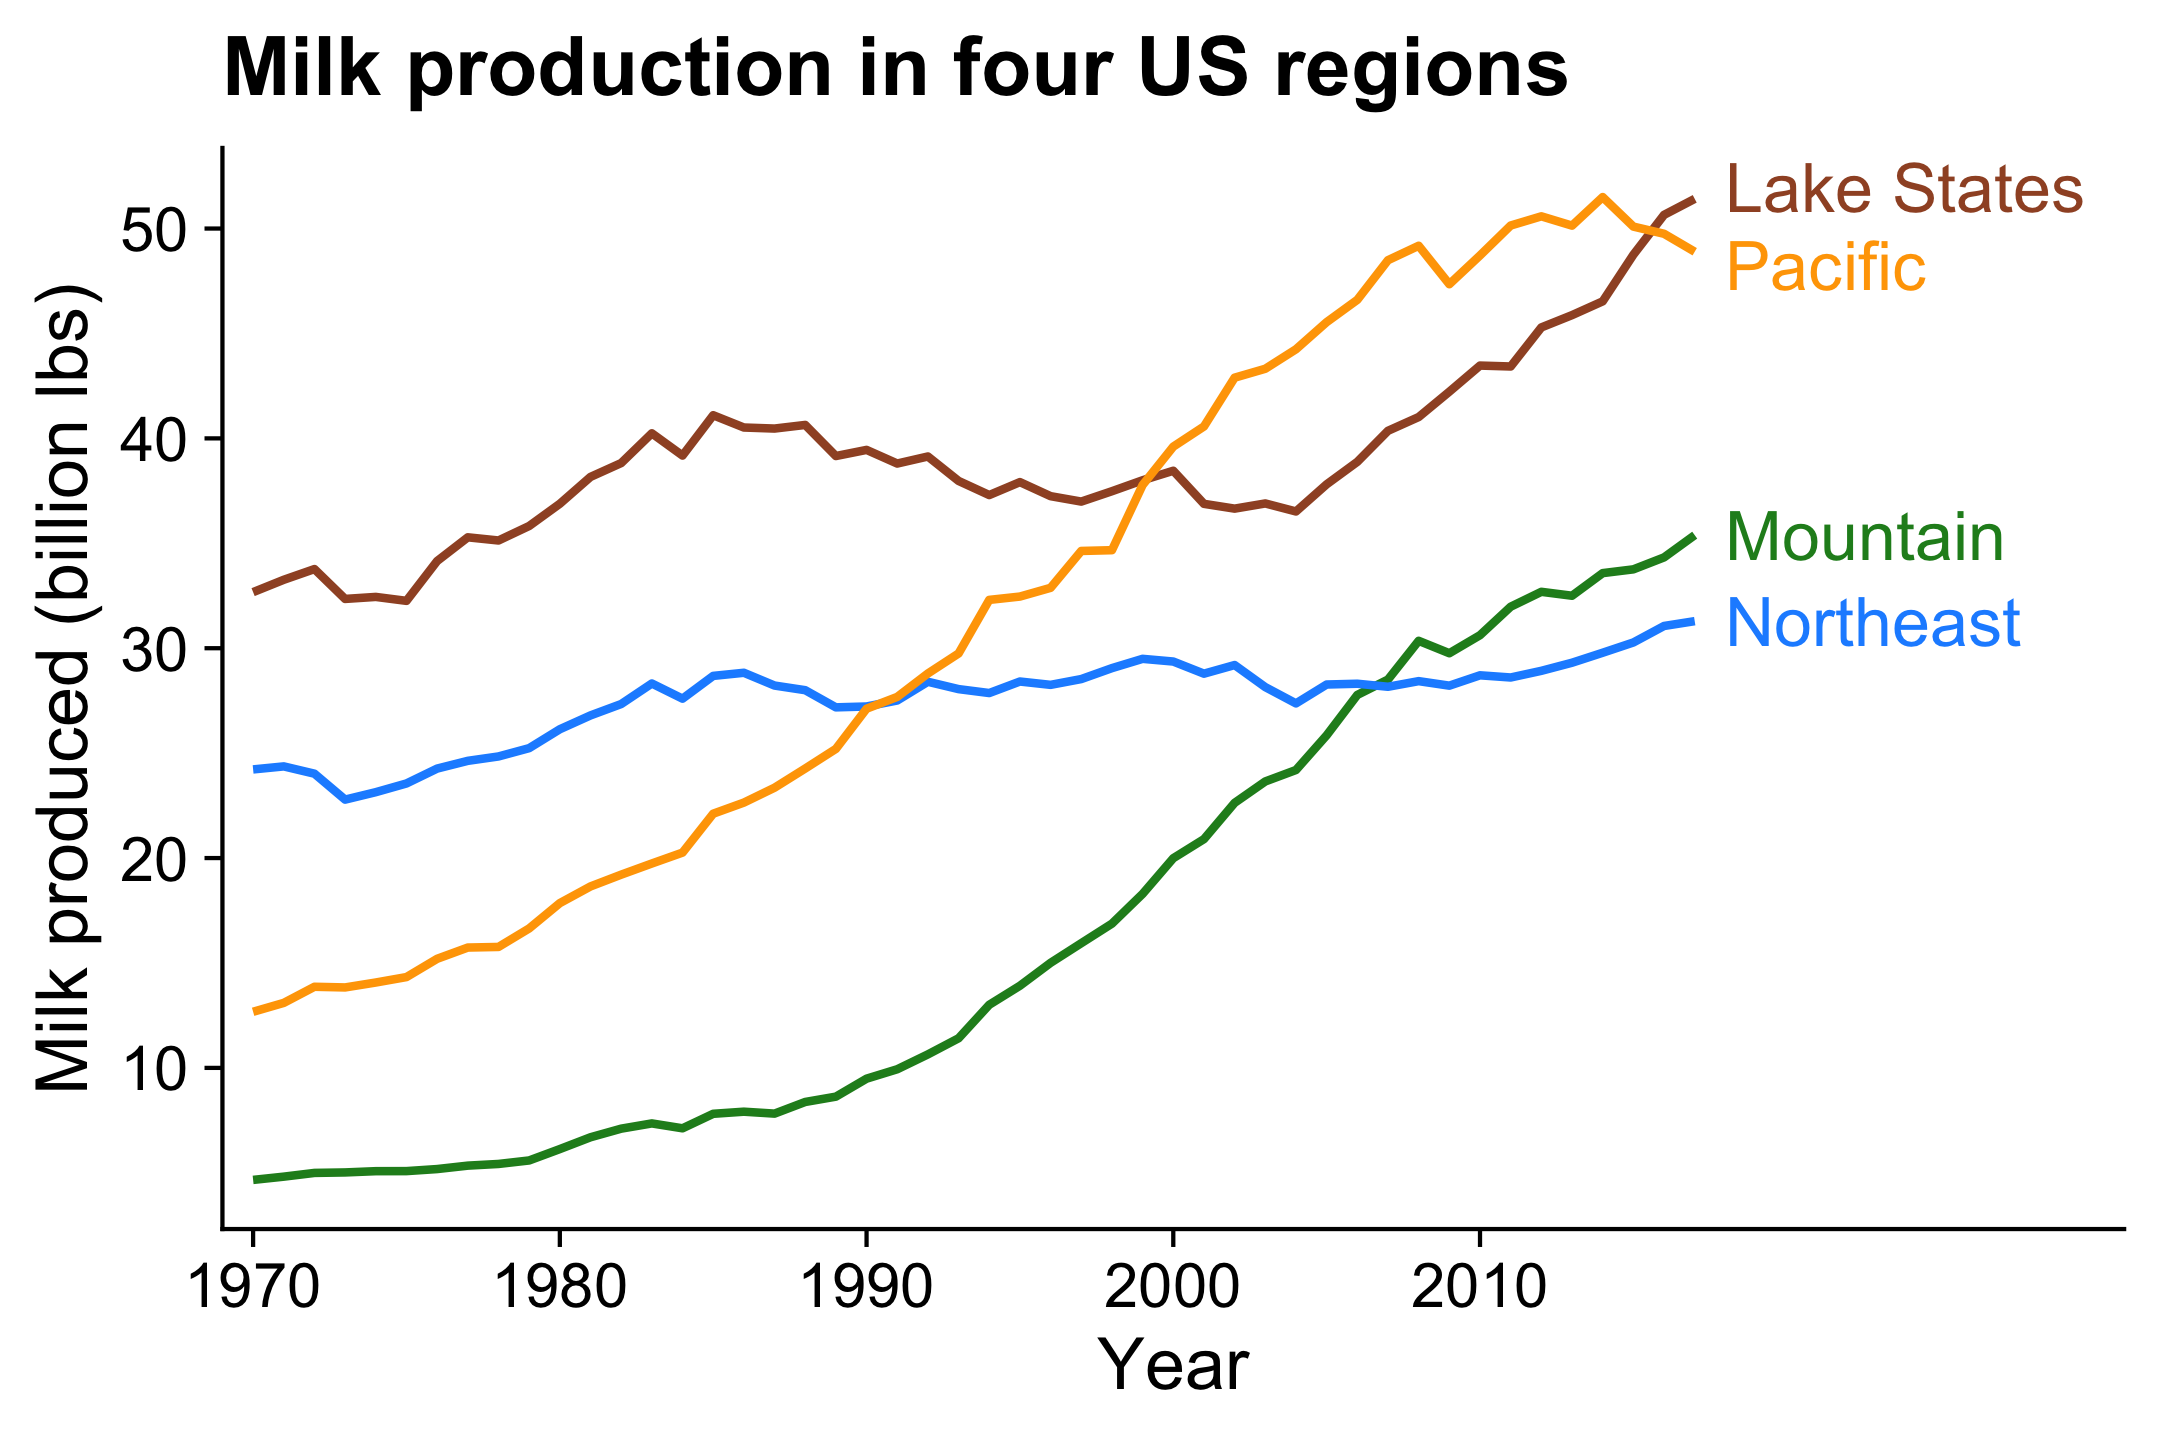
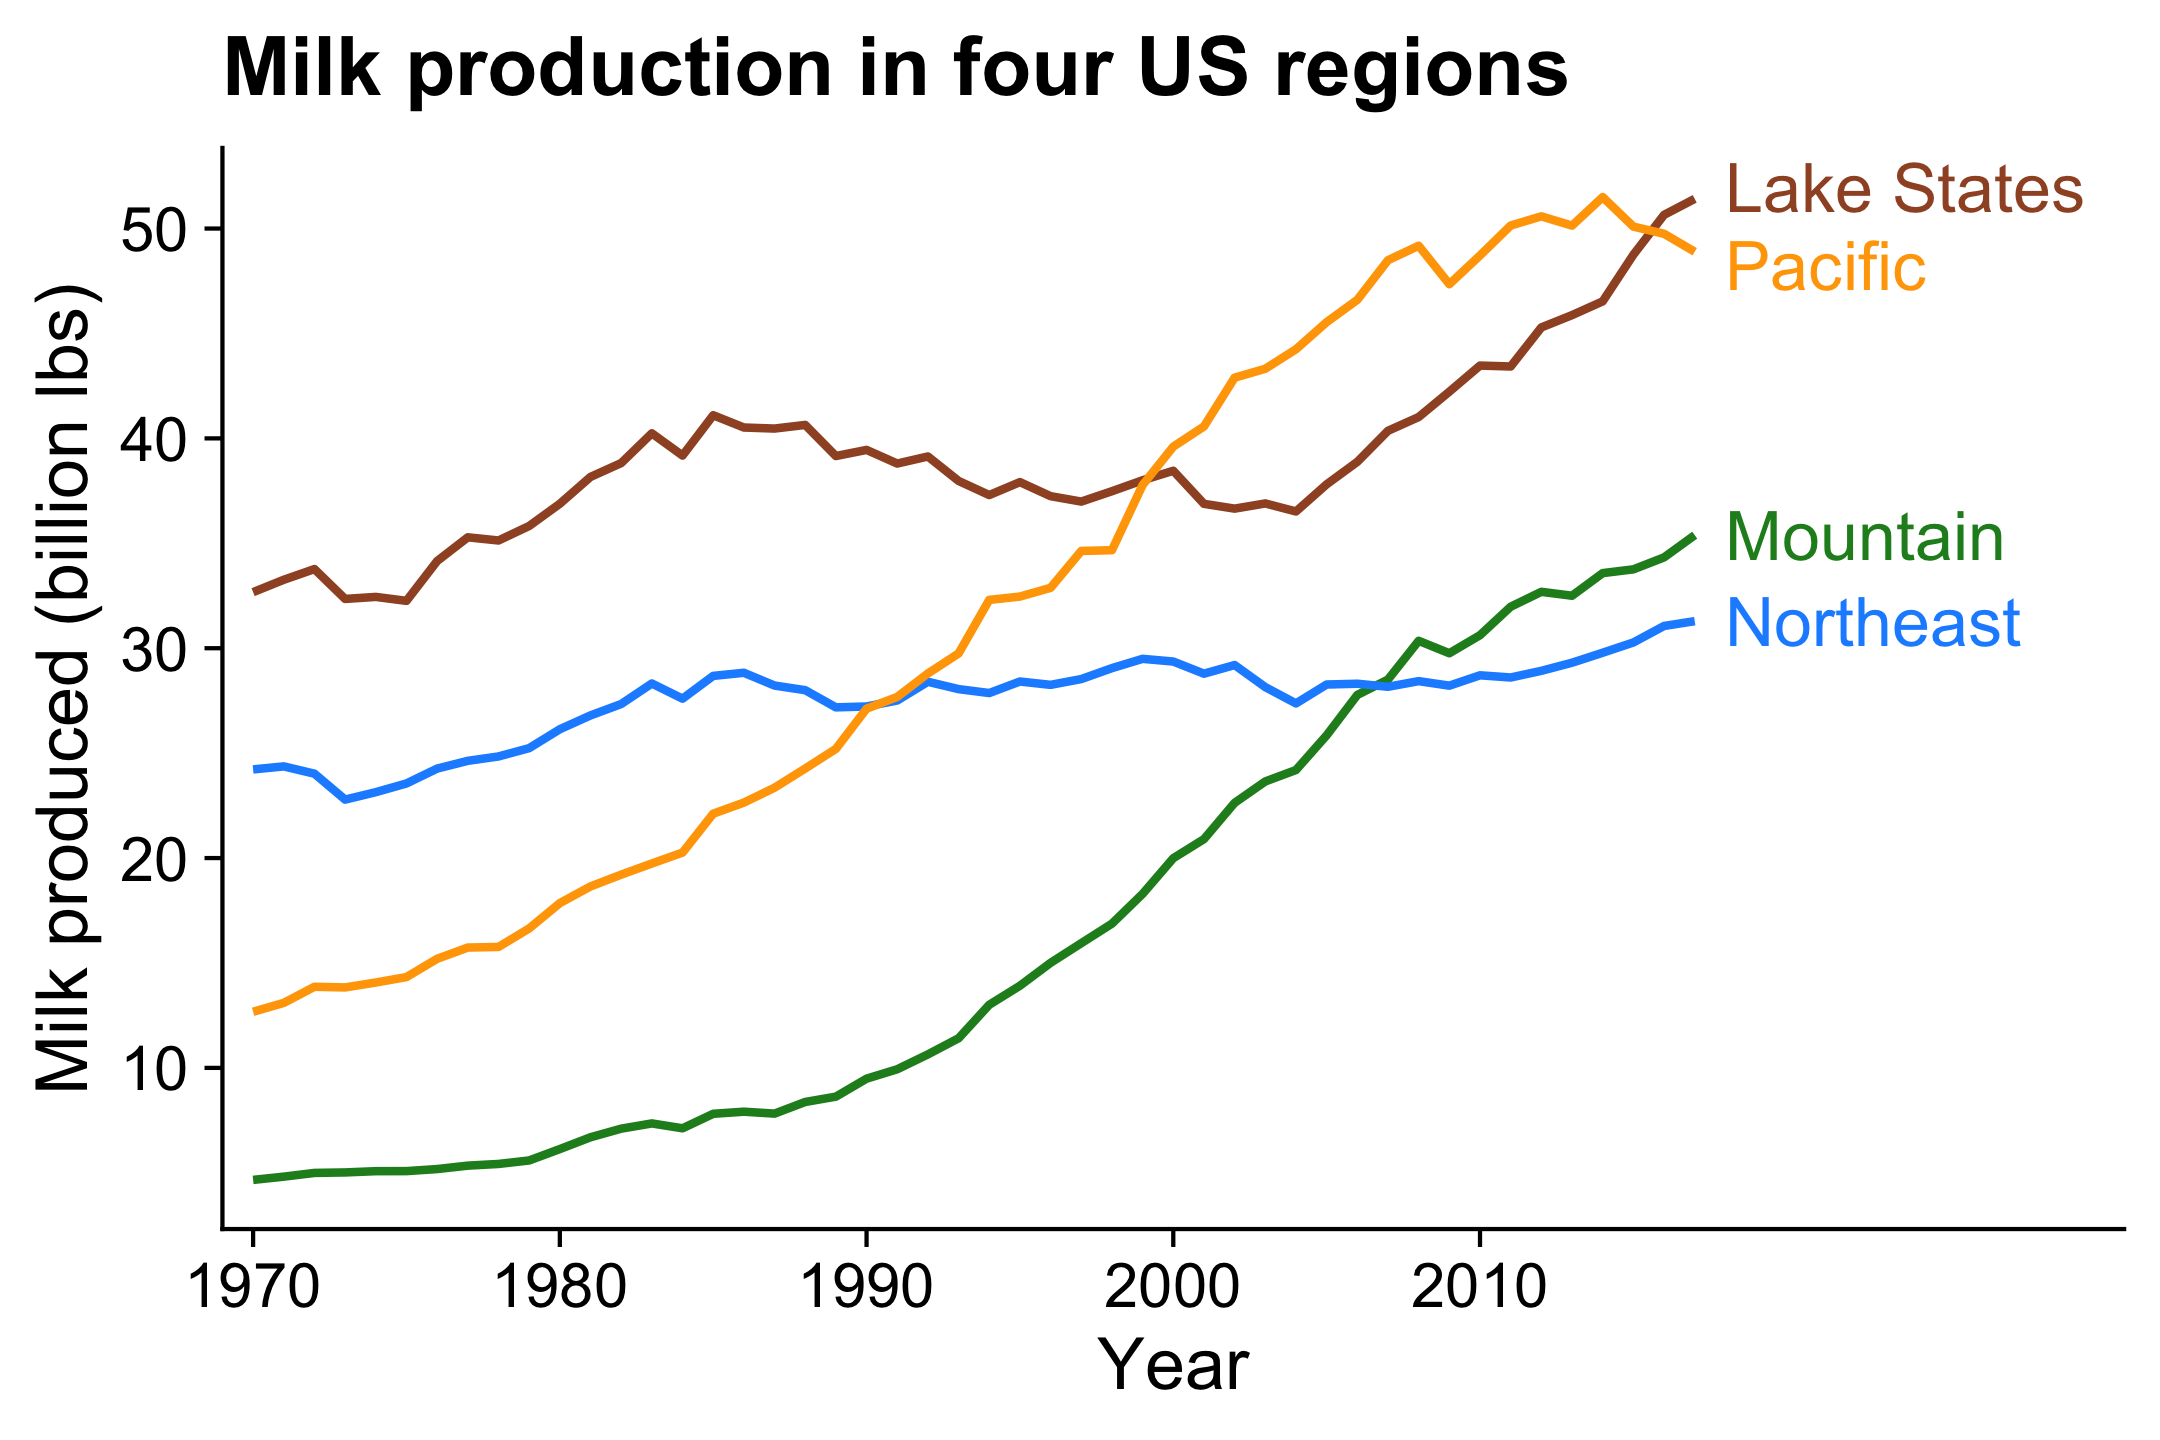
Even better: Directly label
lines to remove legend
lines to remove legend
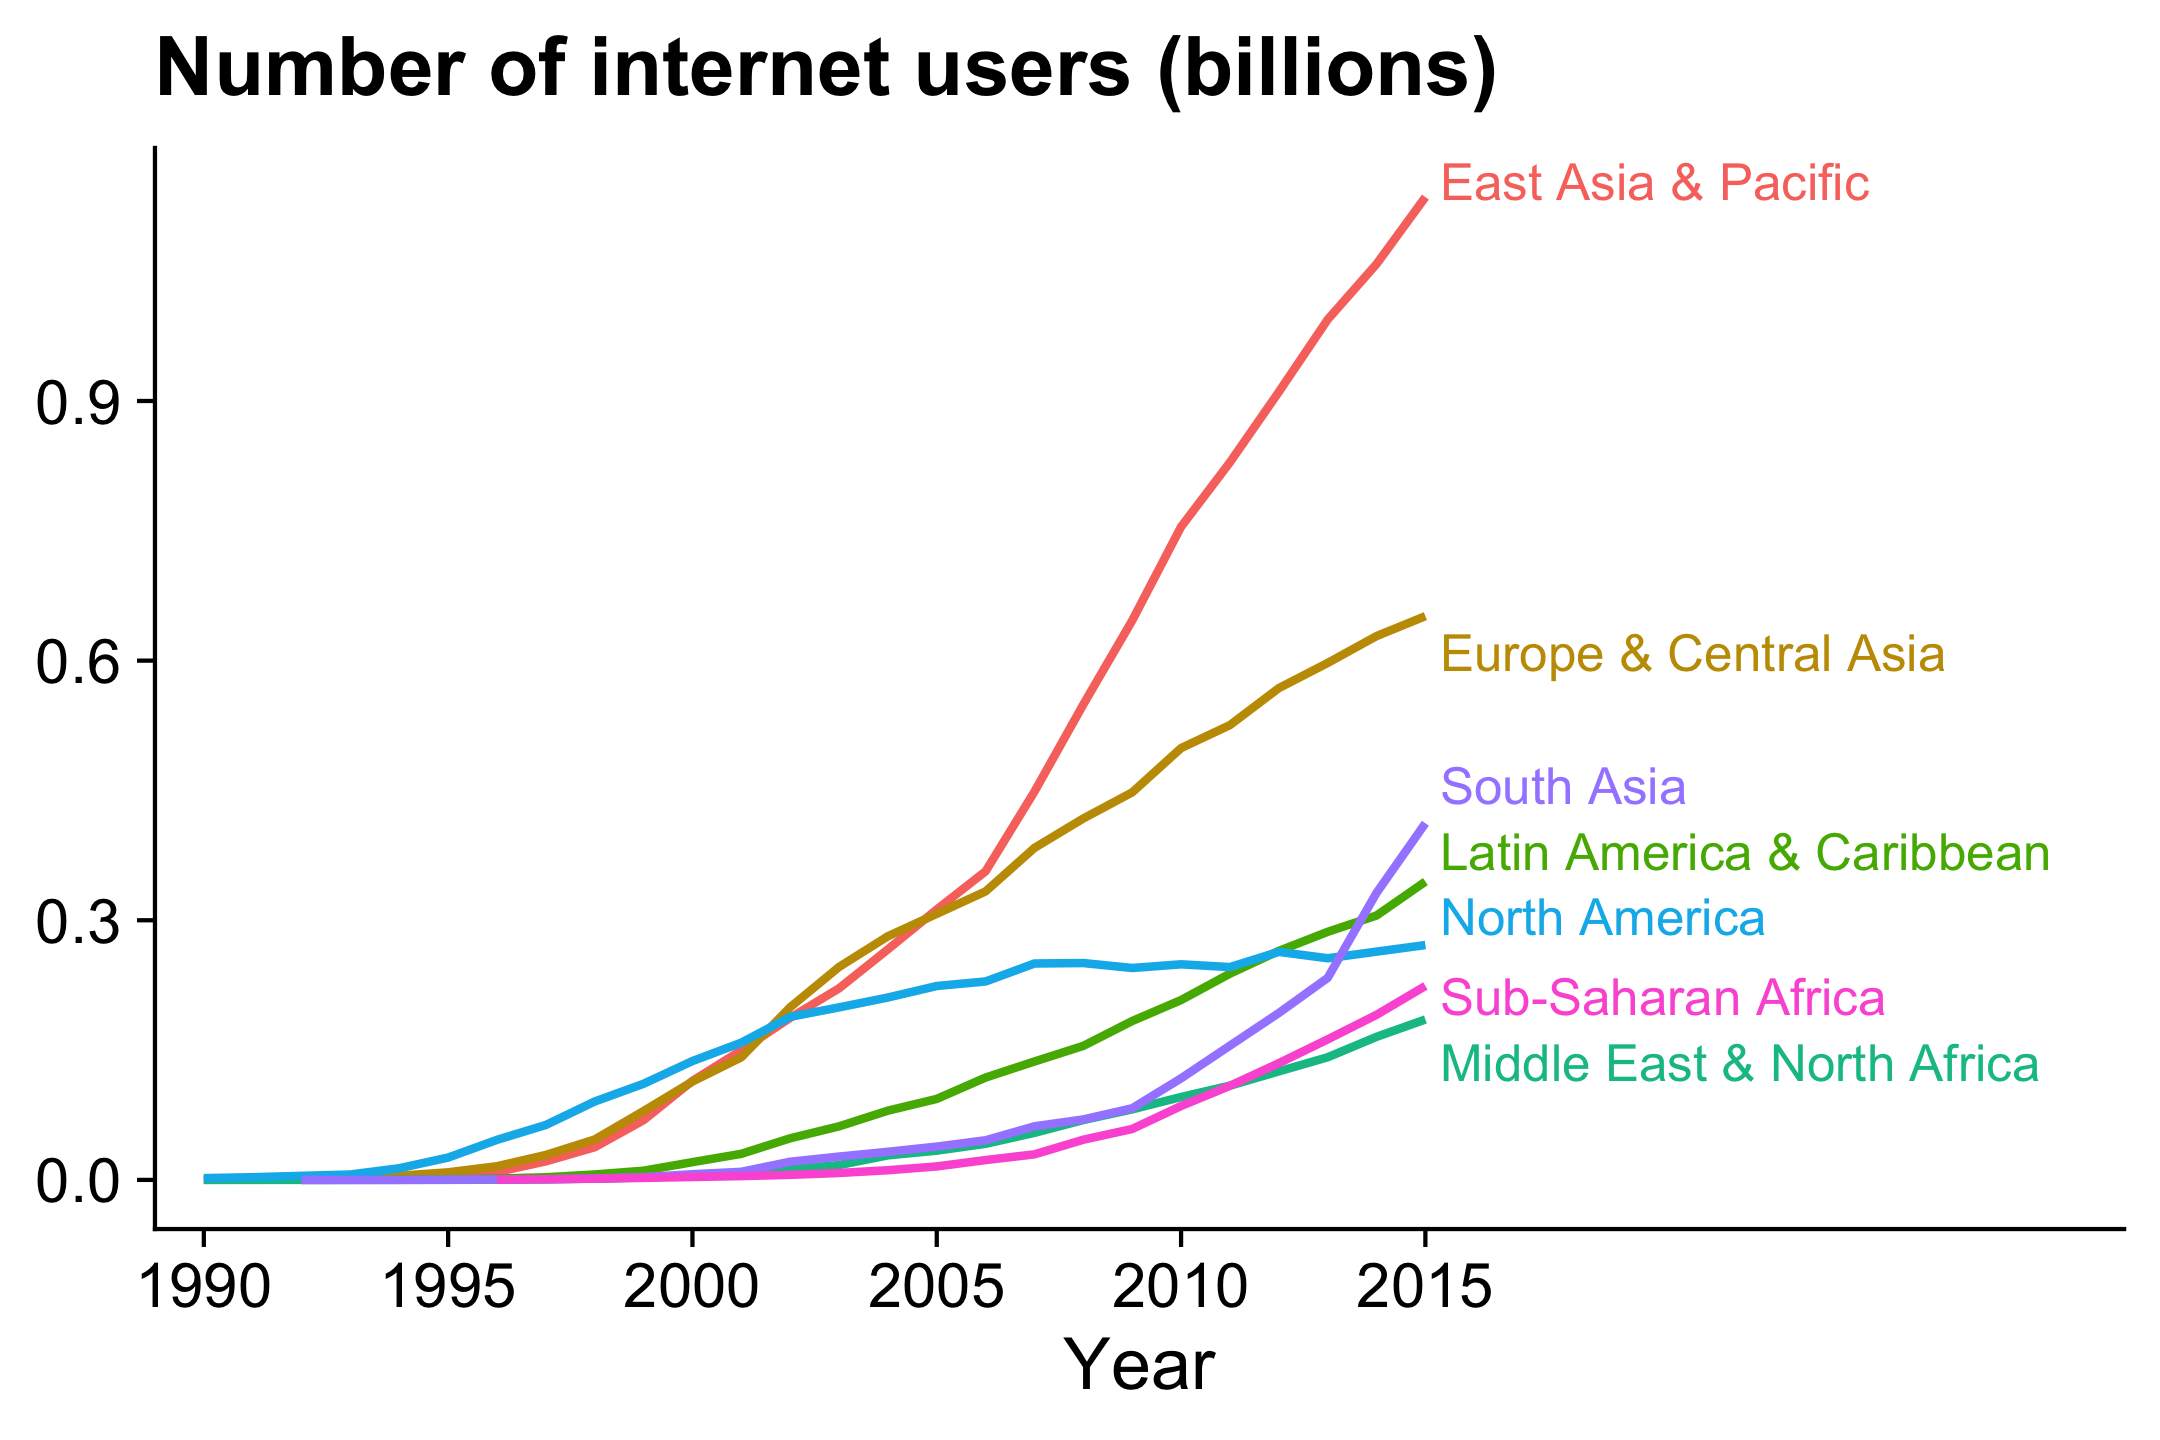
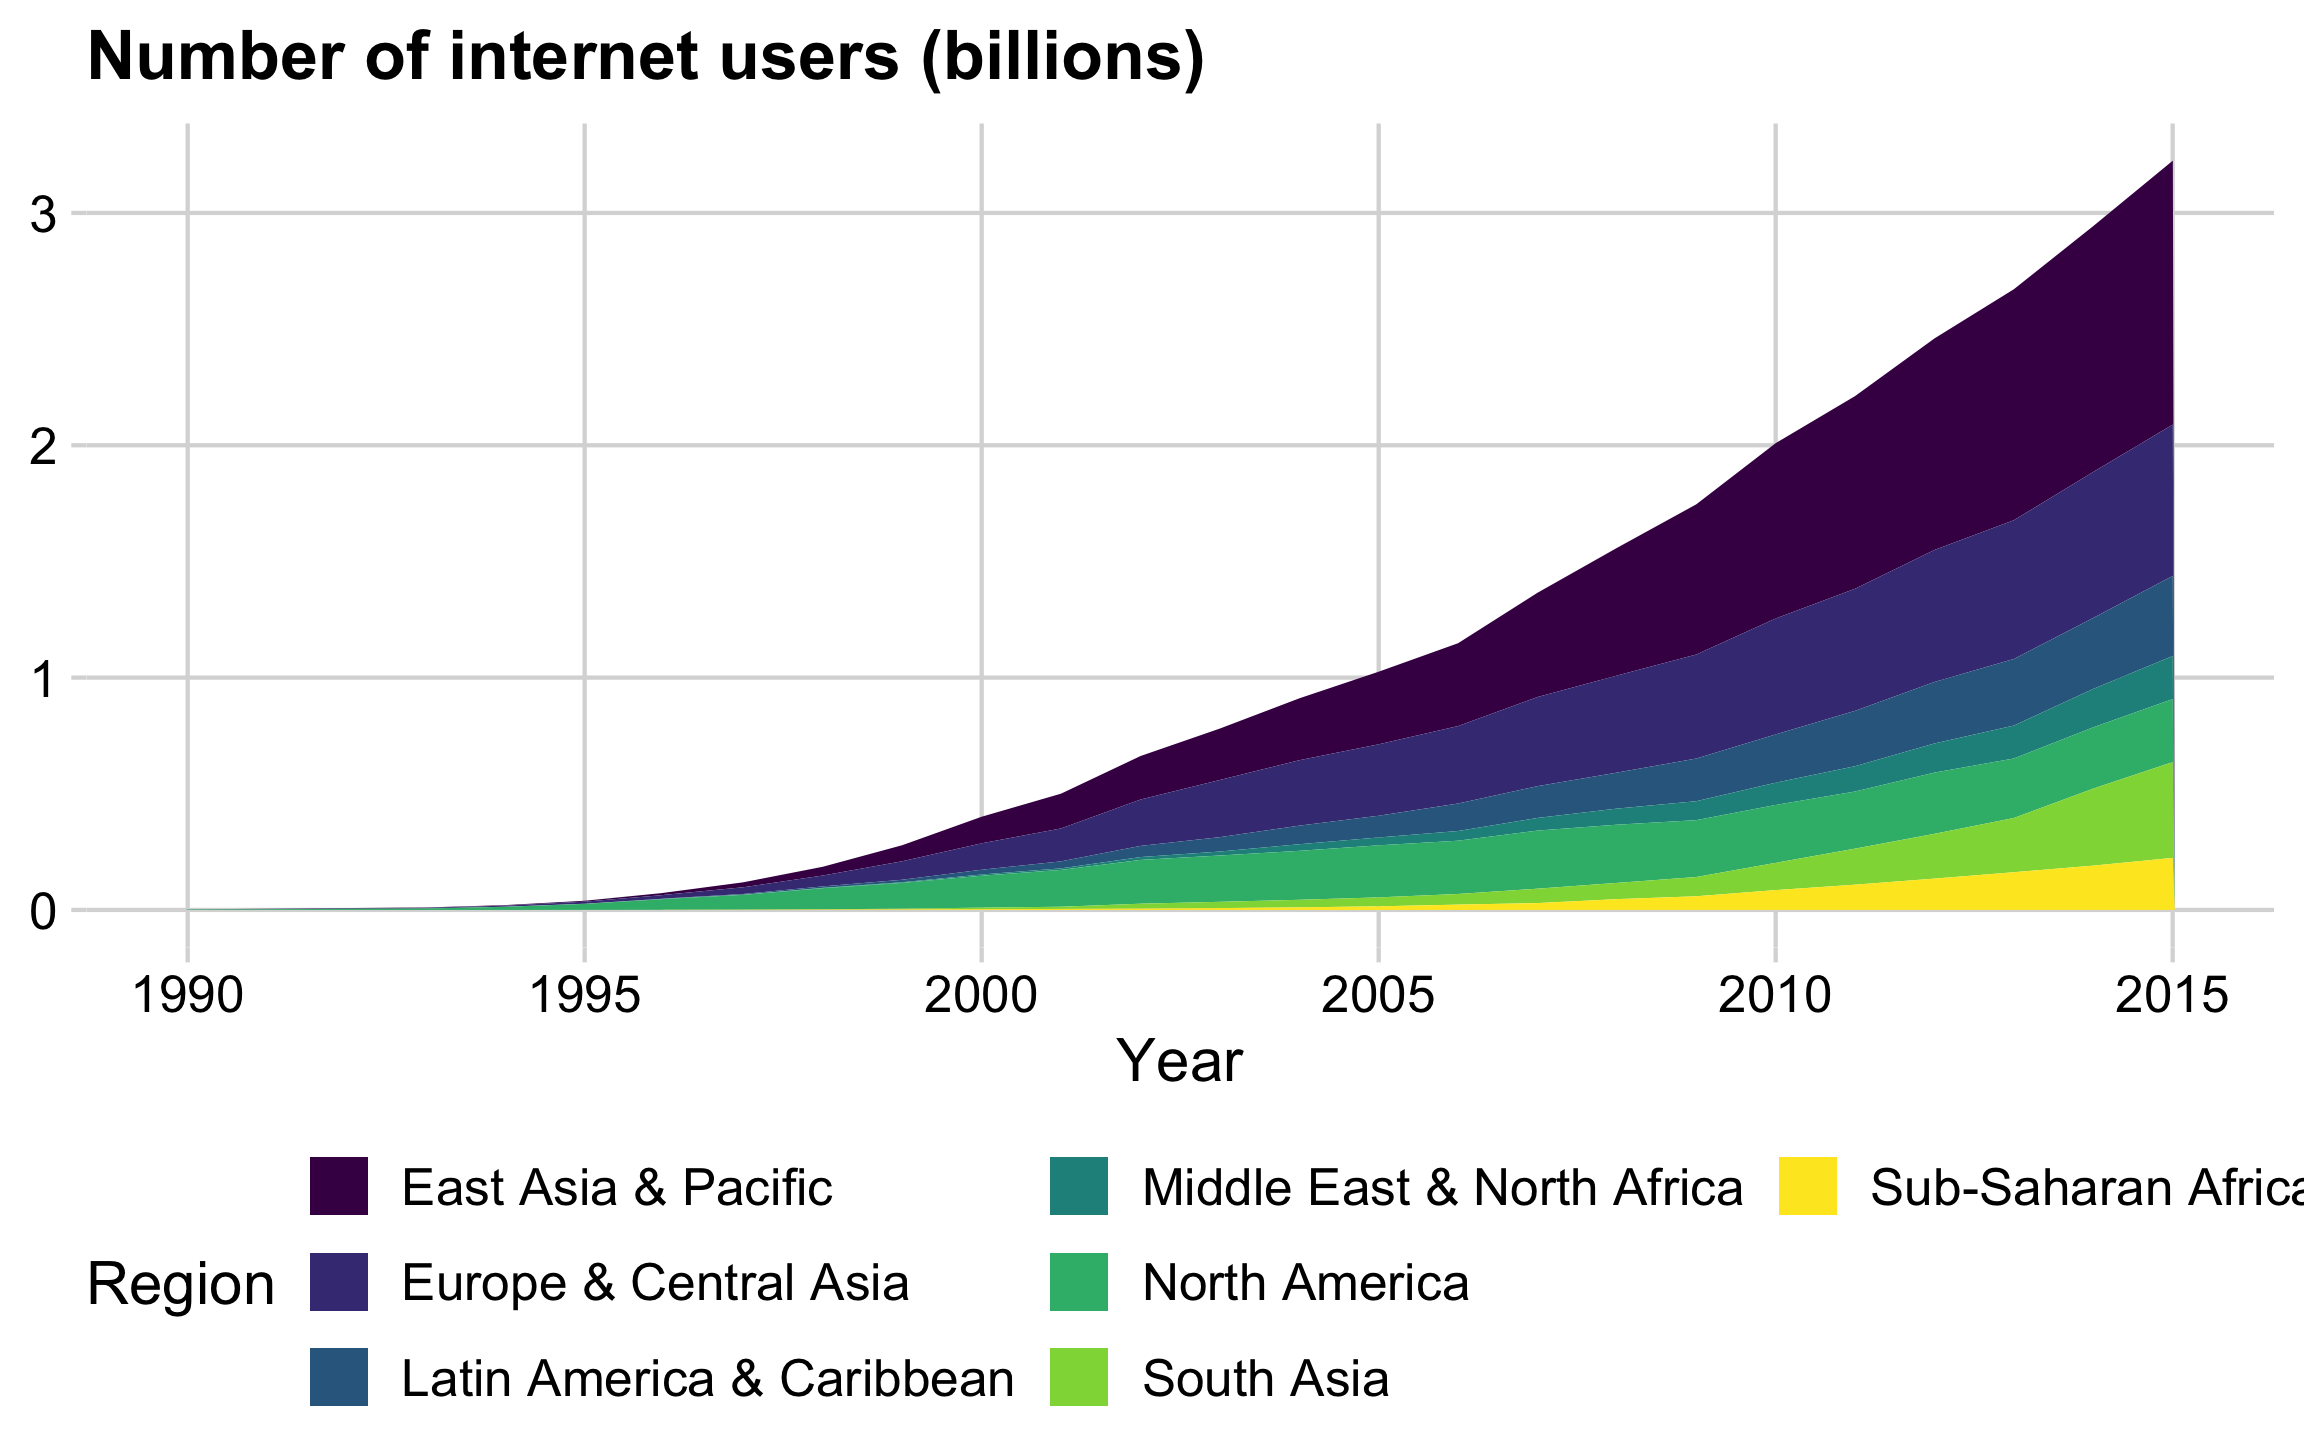
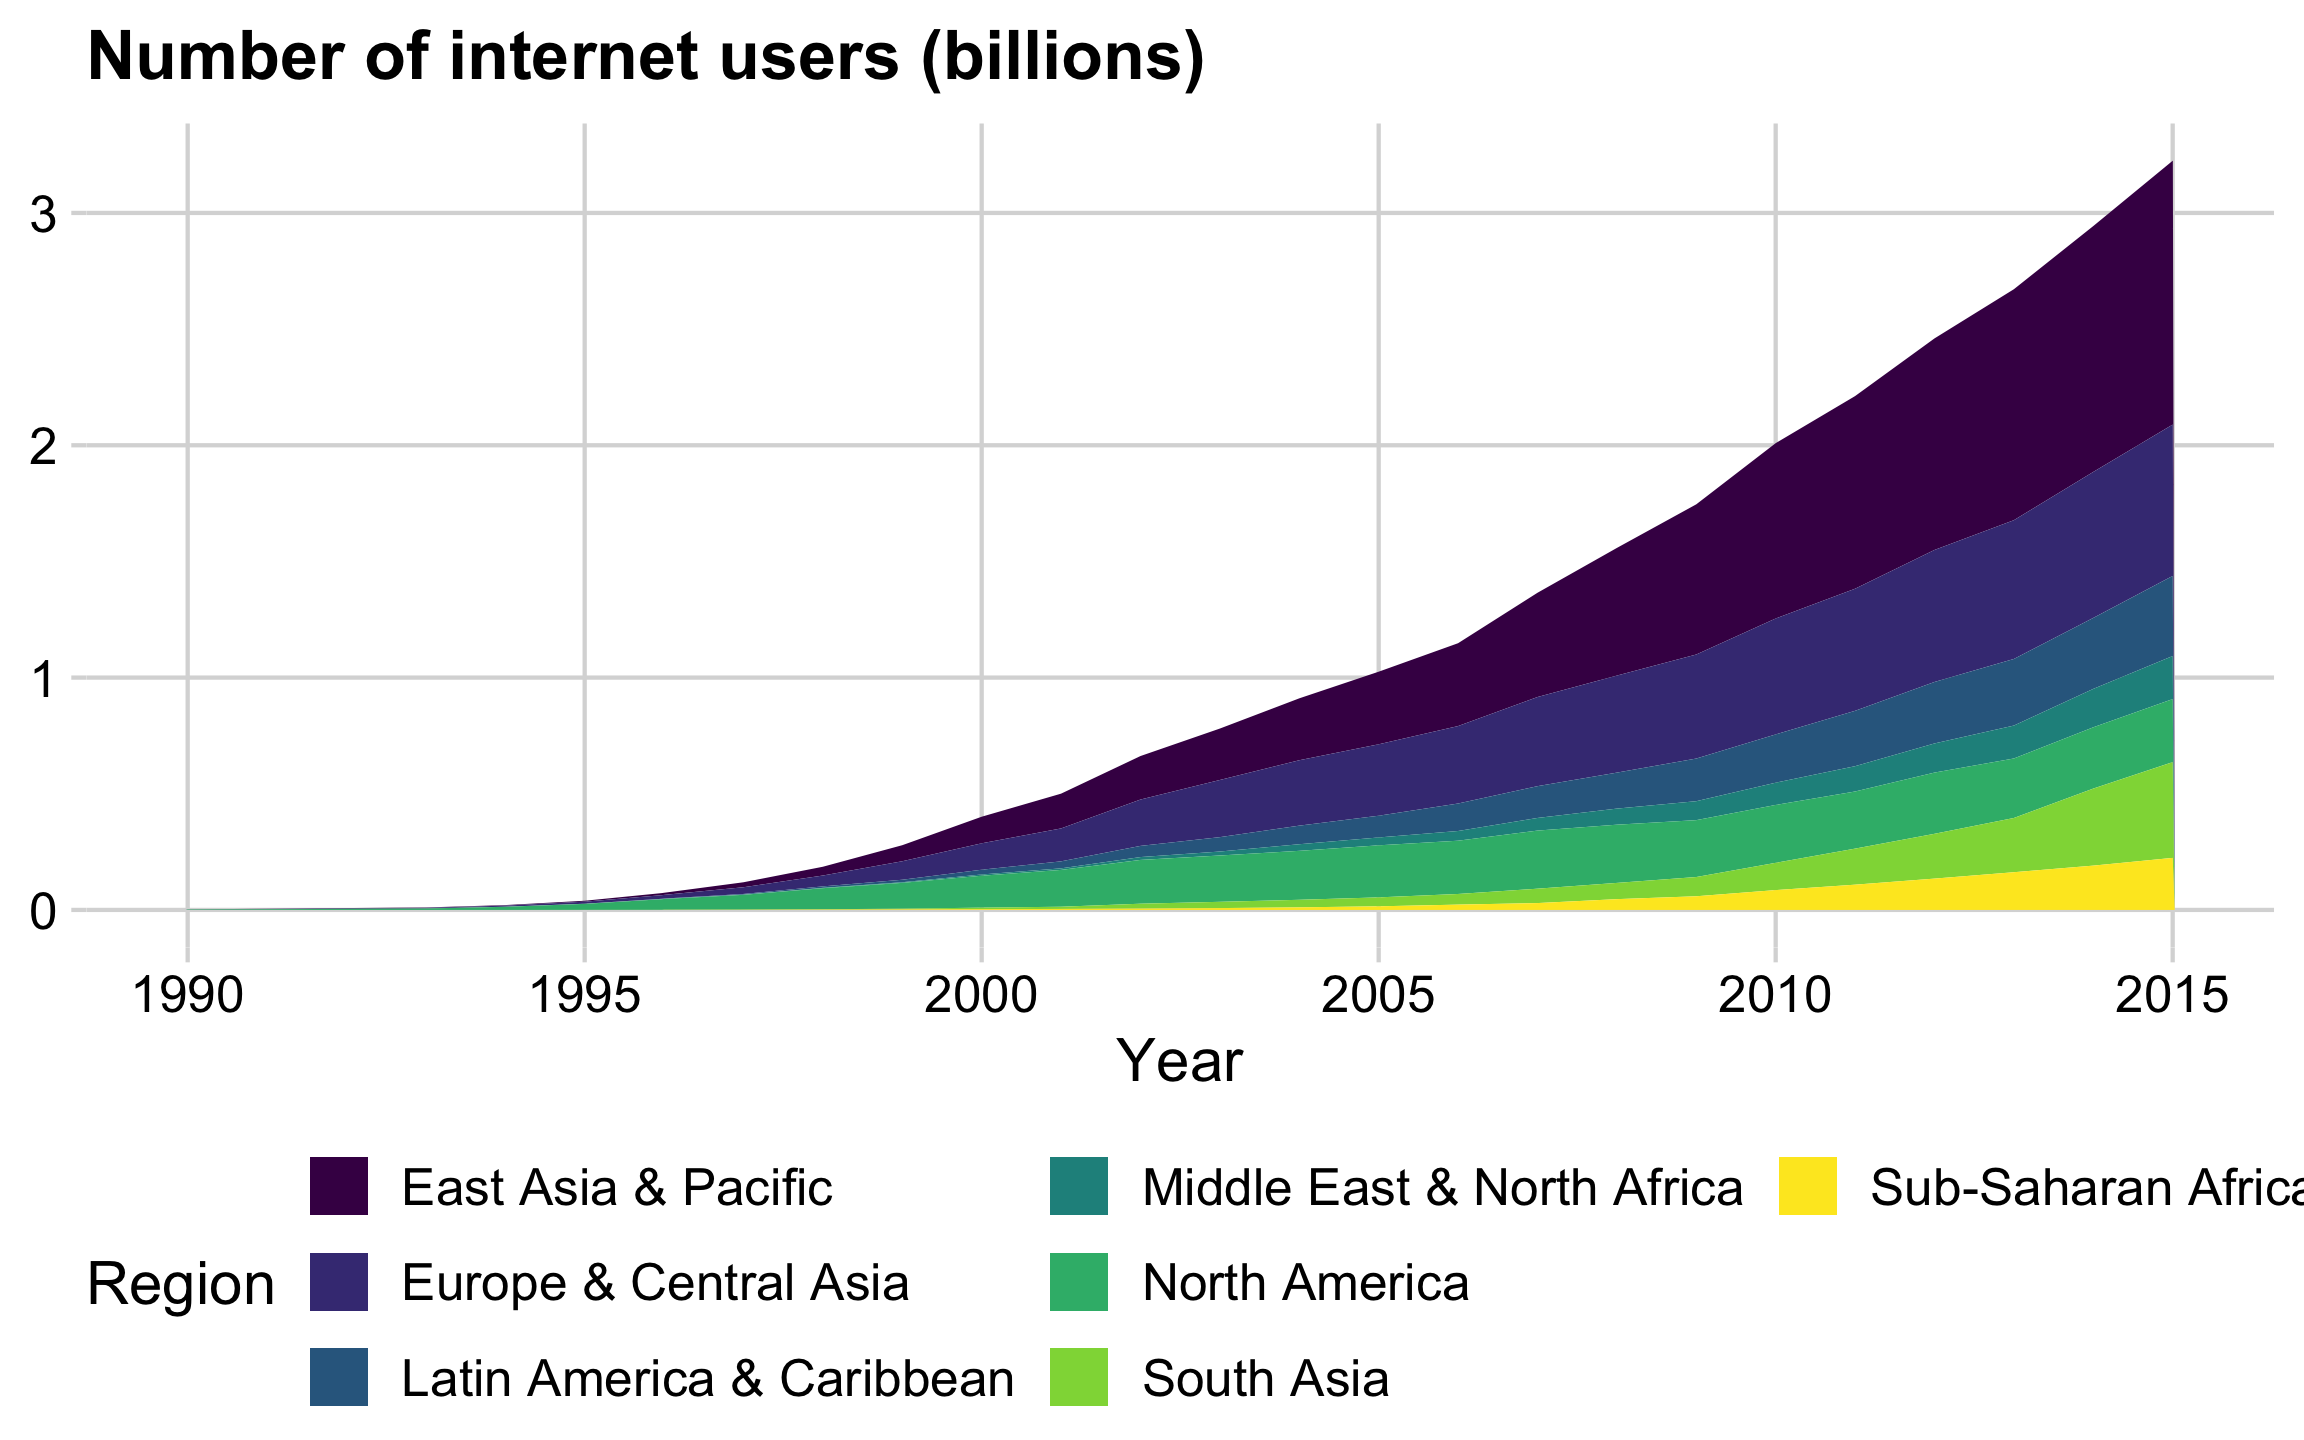
If goal is to communicate the overall / total trend,
consider a stacked area chart
Highlights regional trends
Highlights overall / total trend
If you have lots of categories:
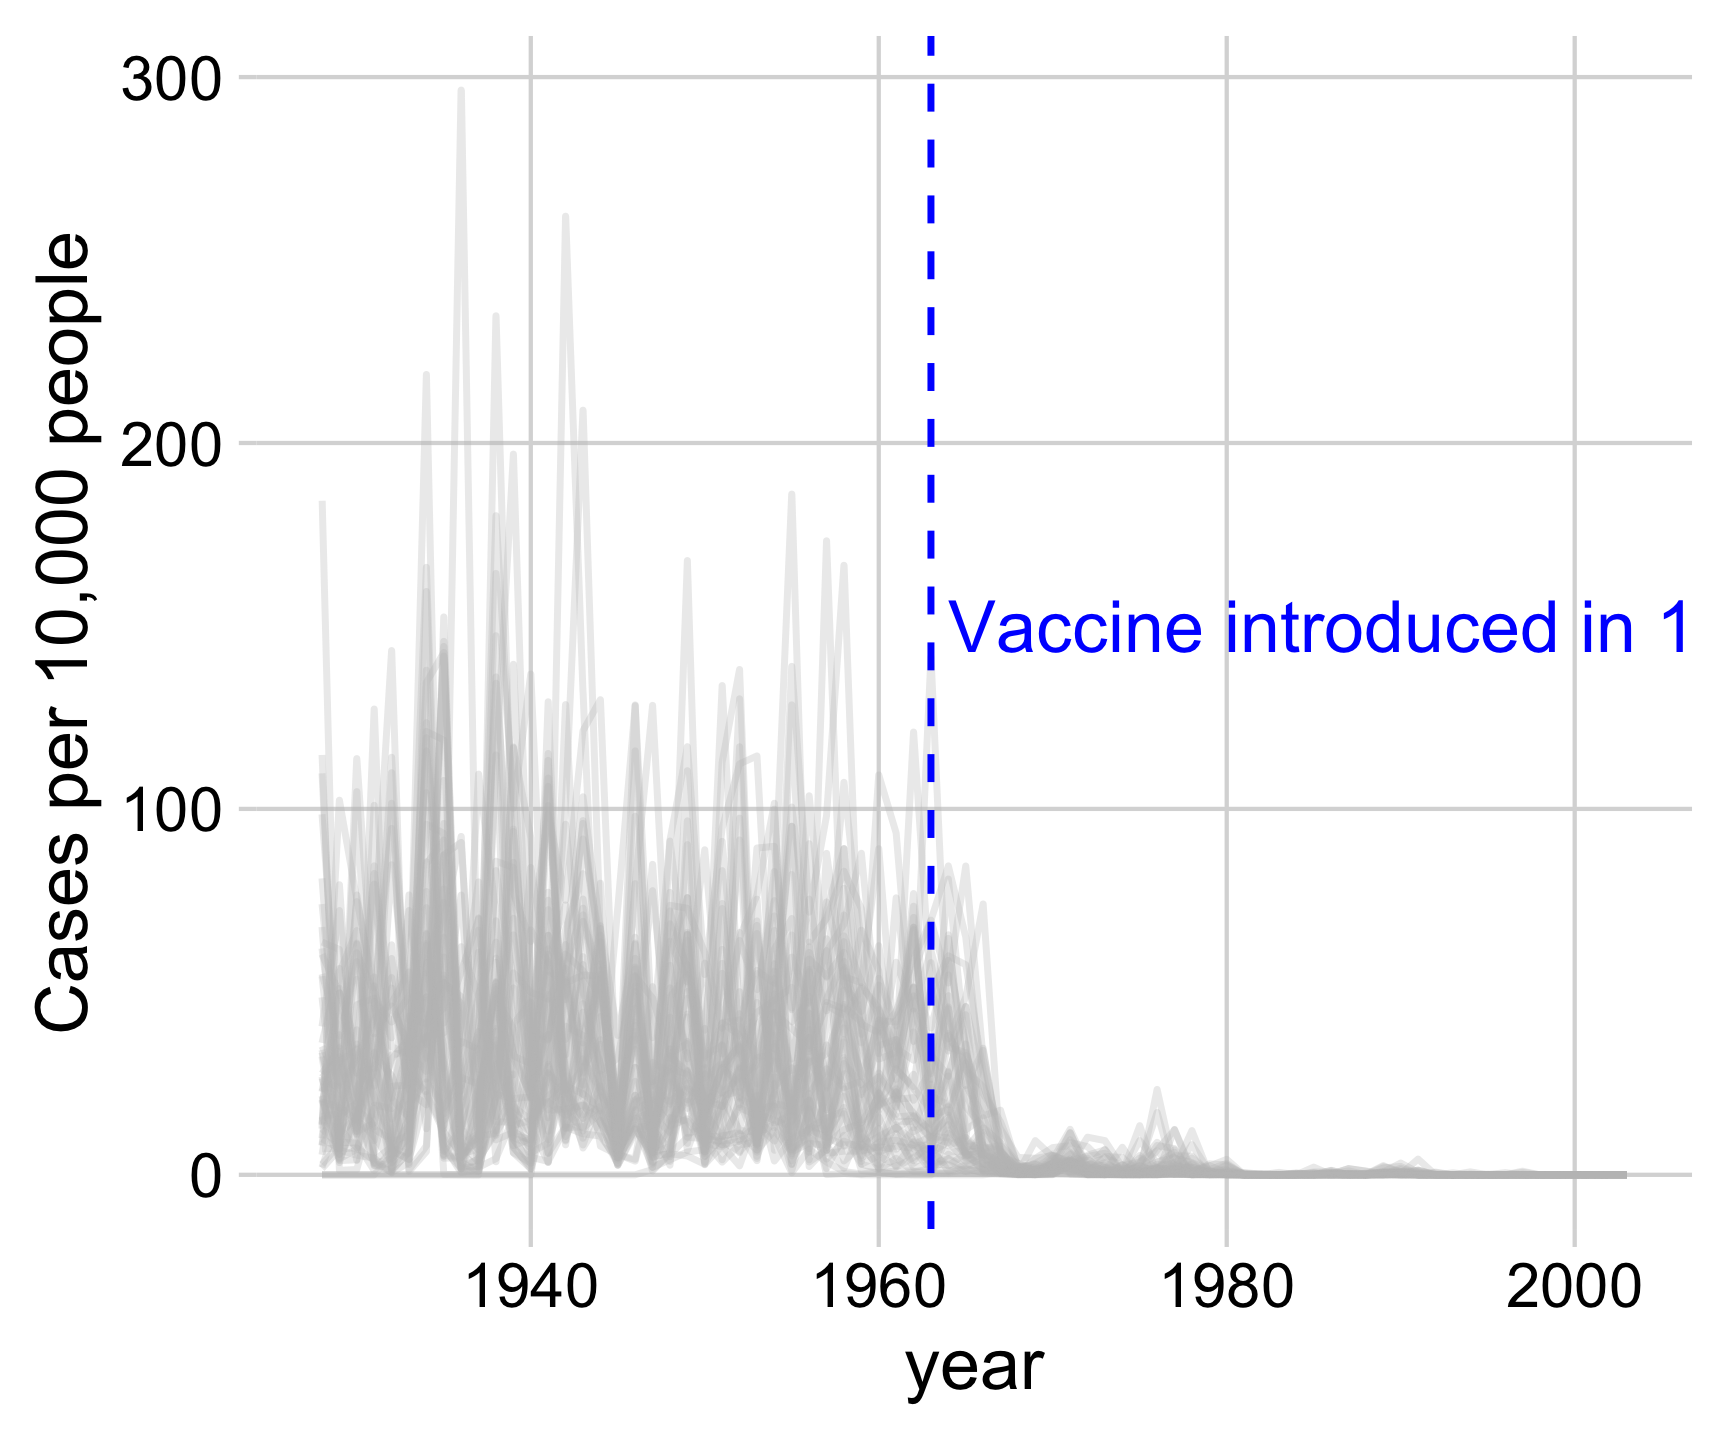
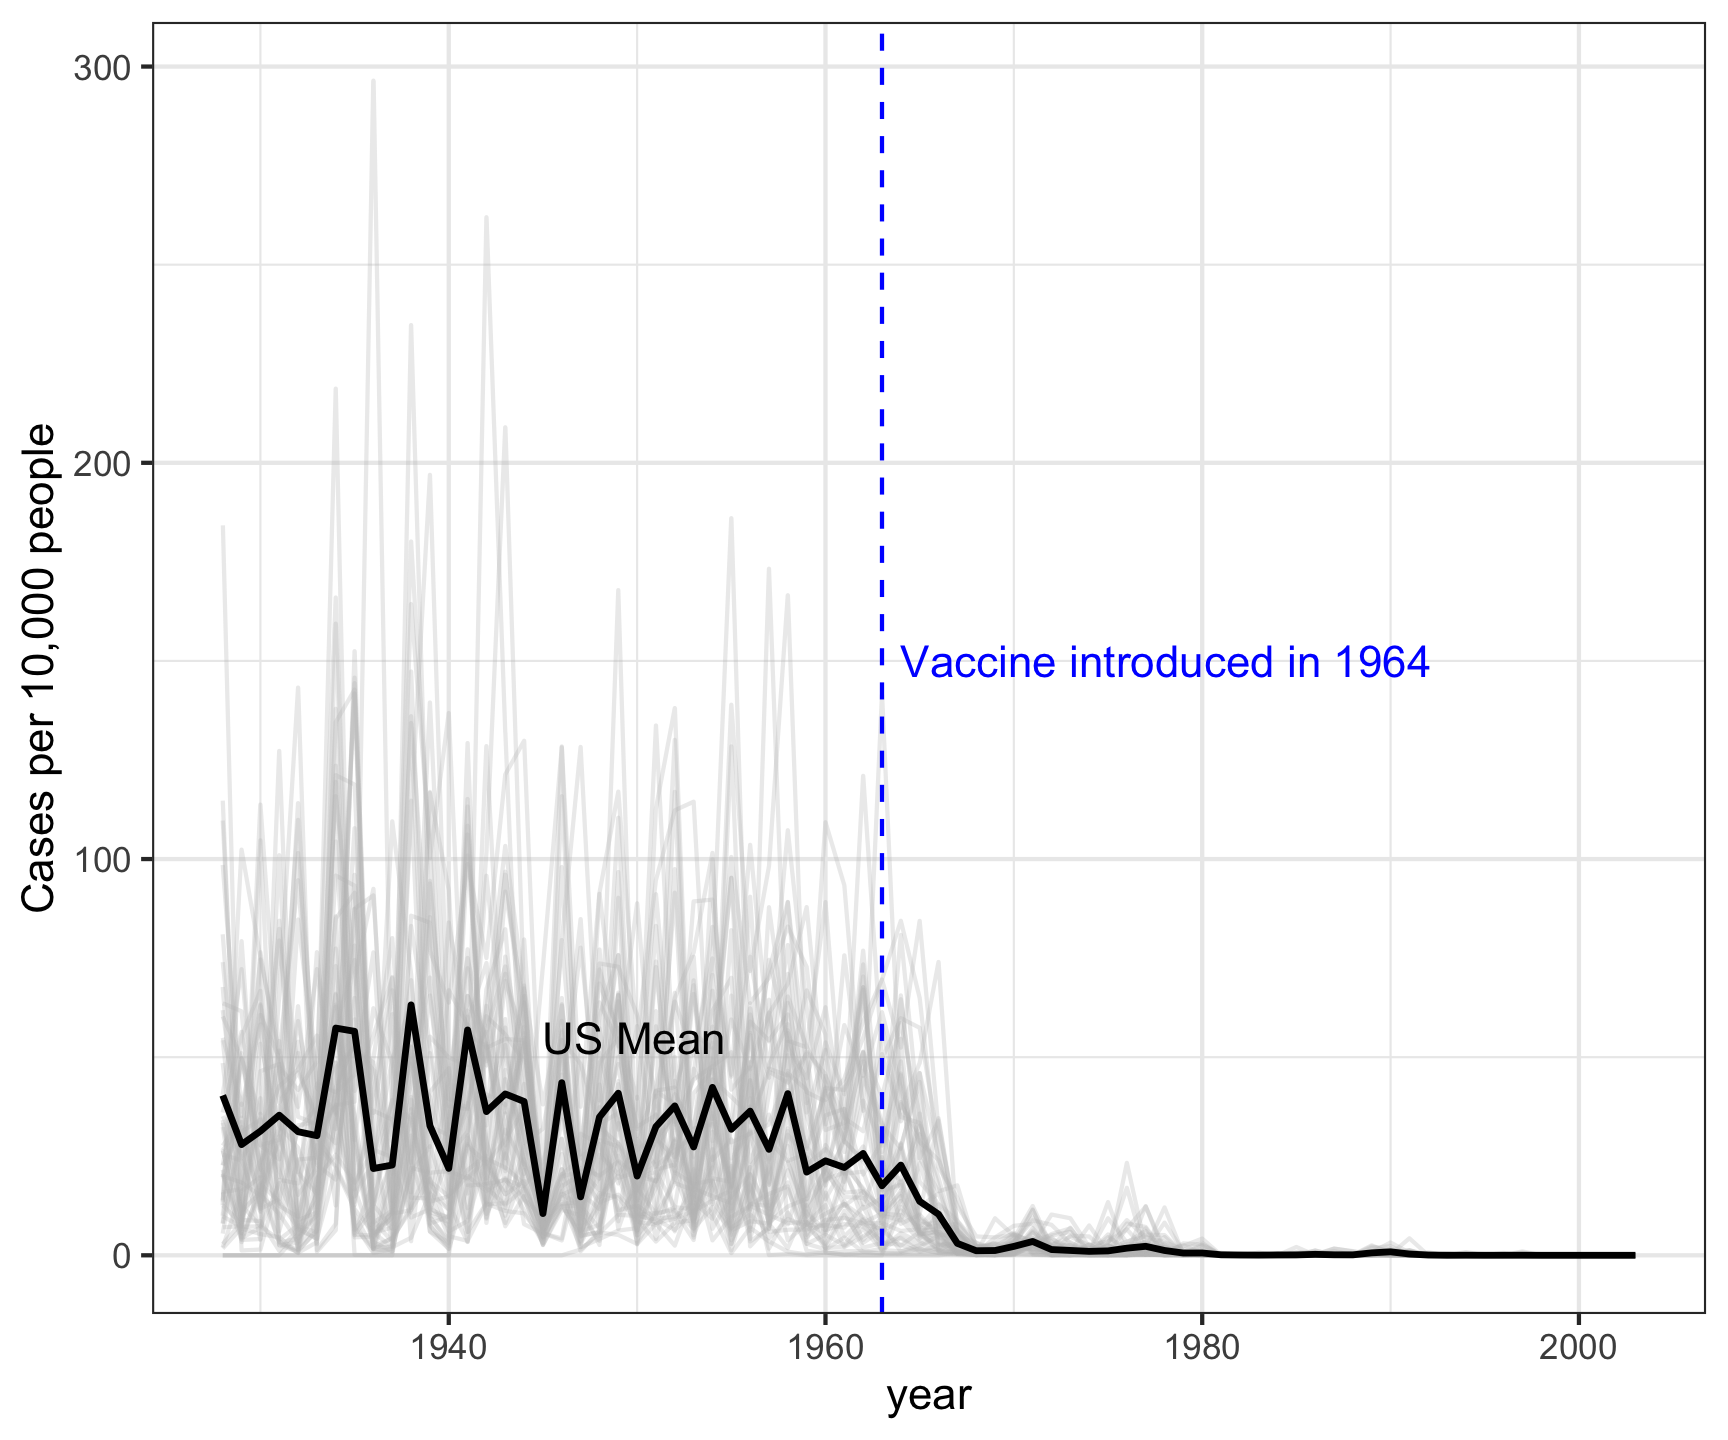
1) Plot all the data with the average highlighted
Measles in California
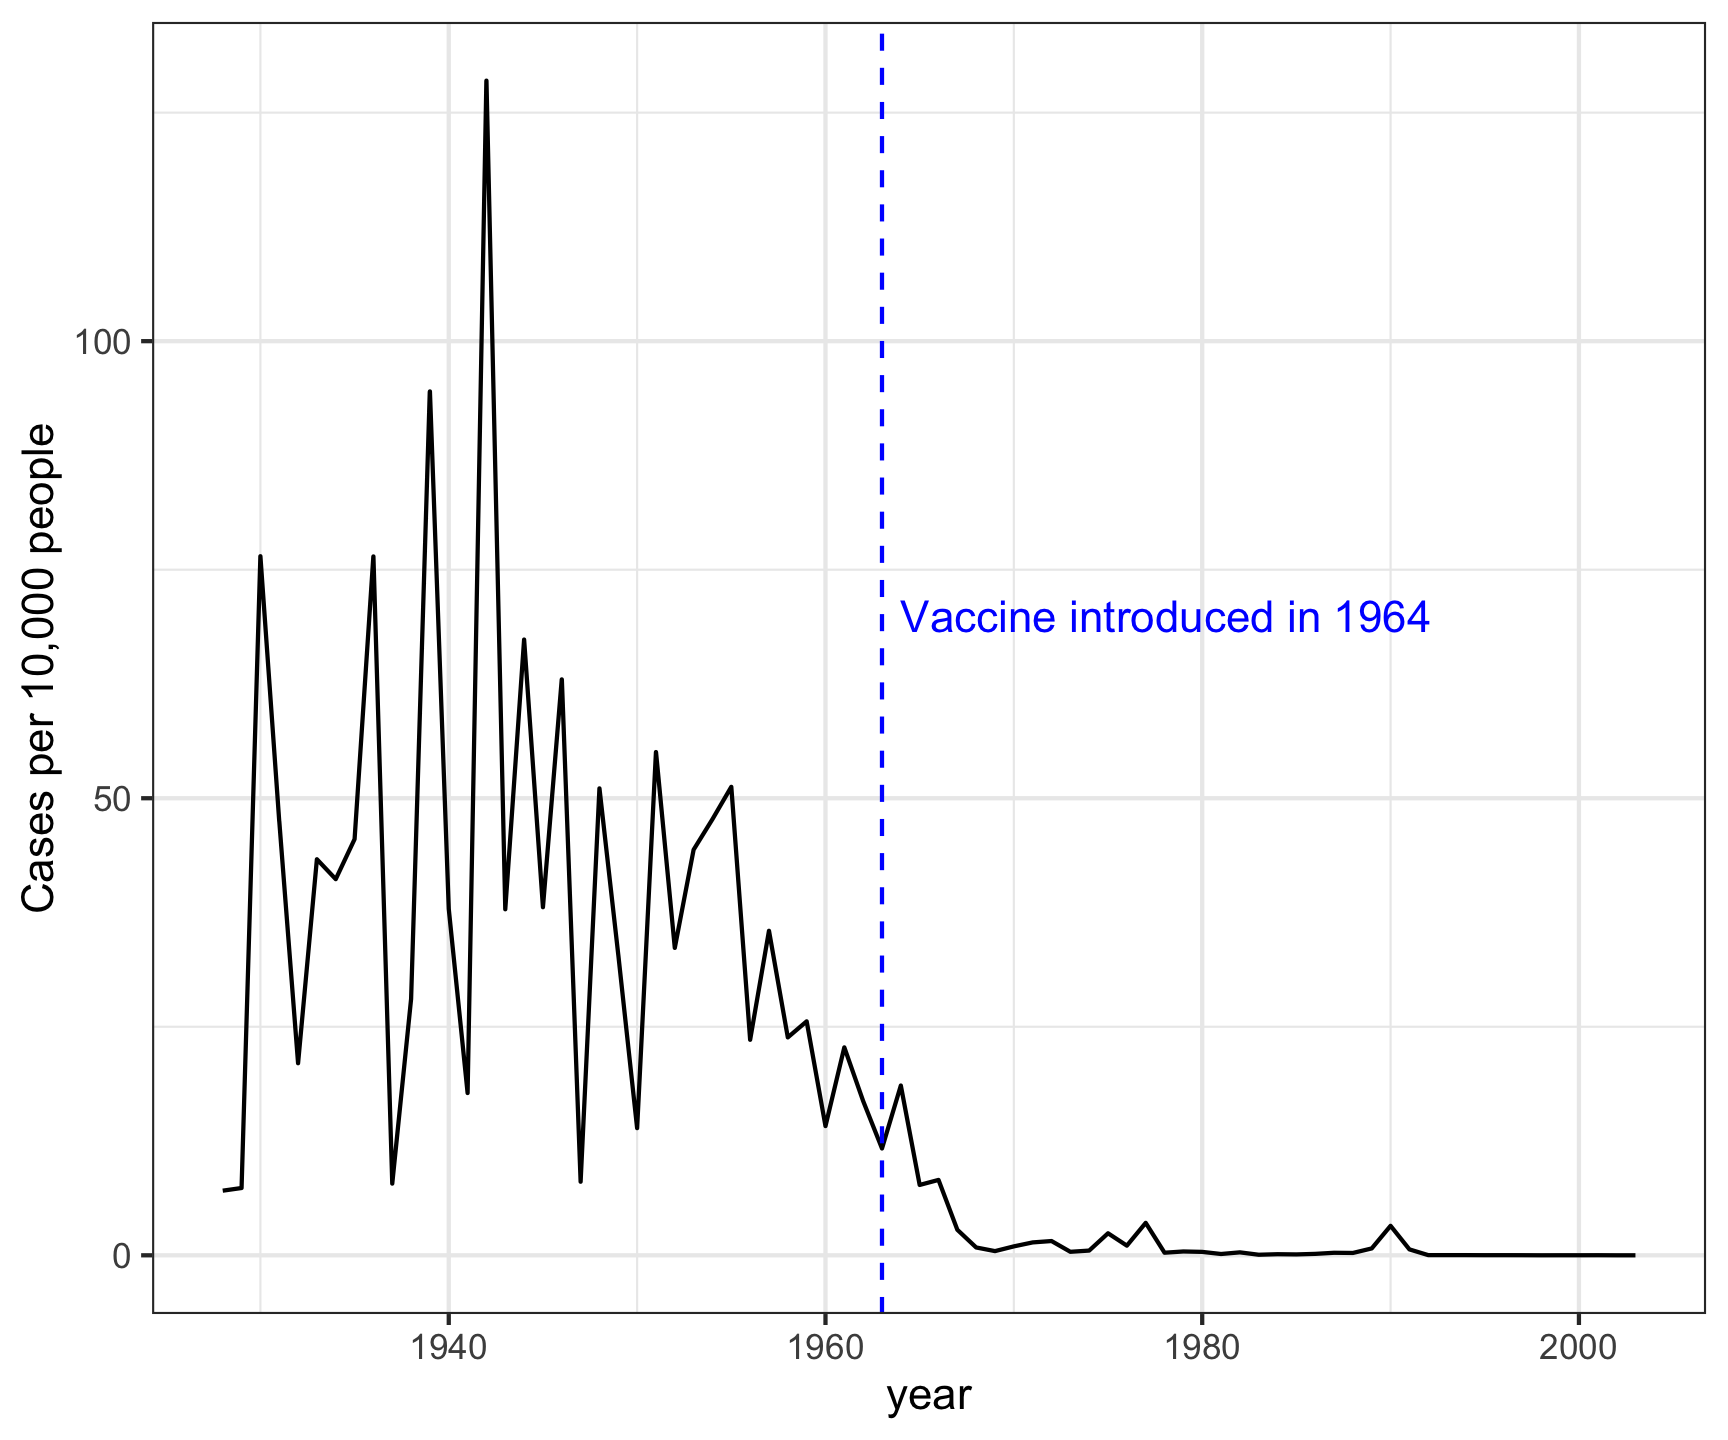
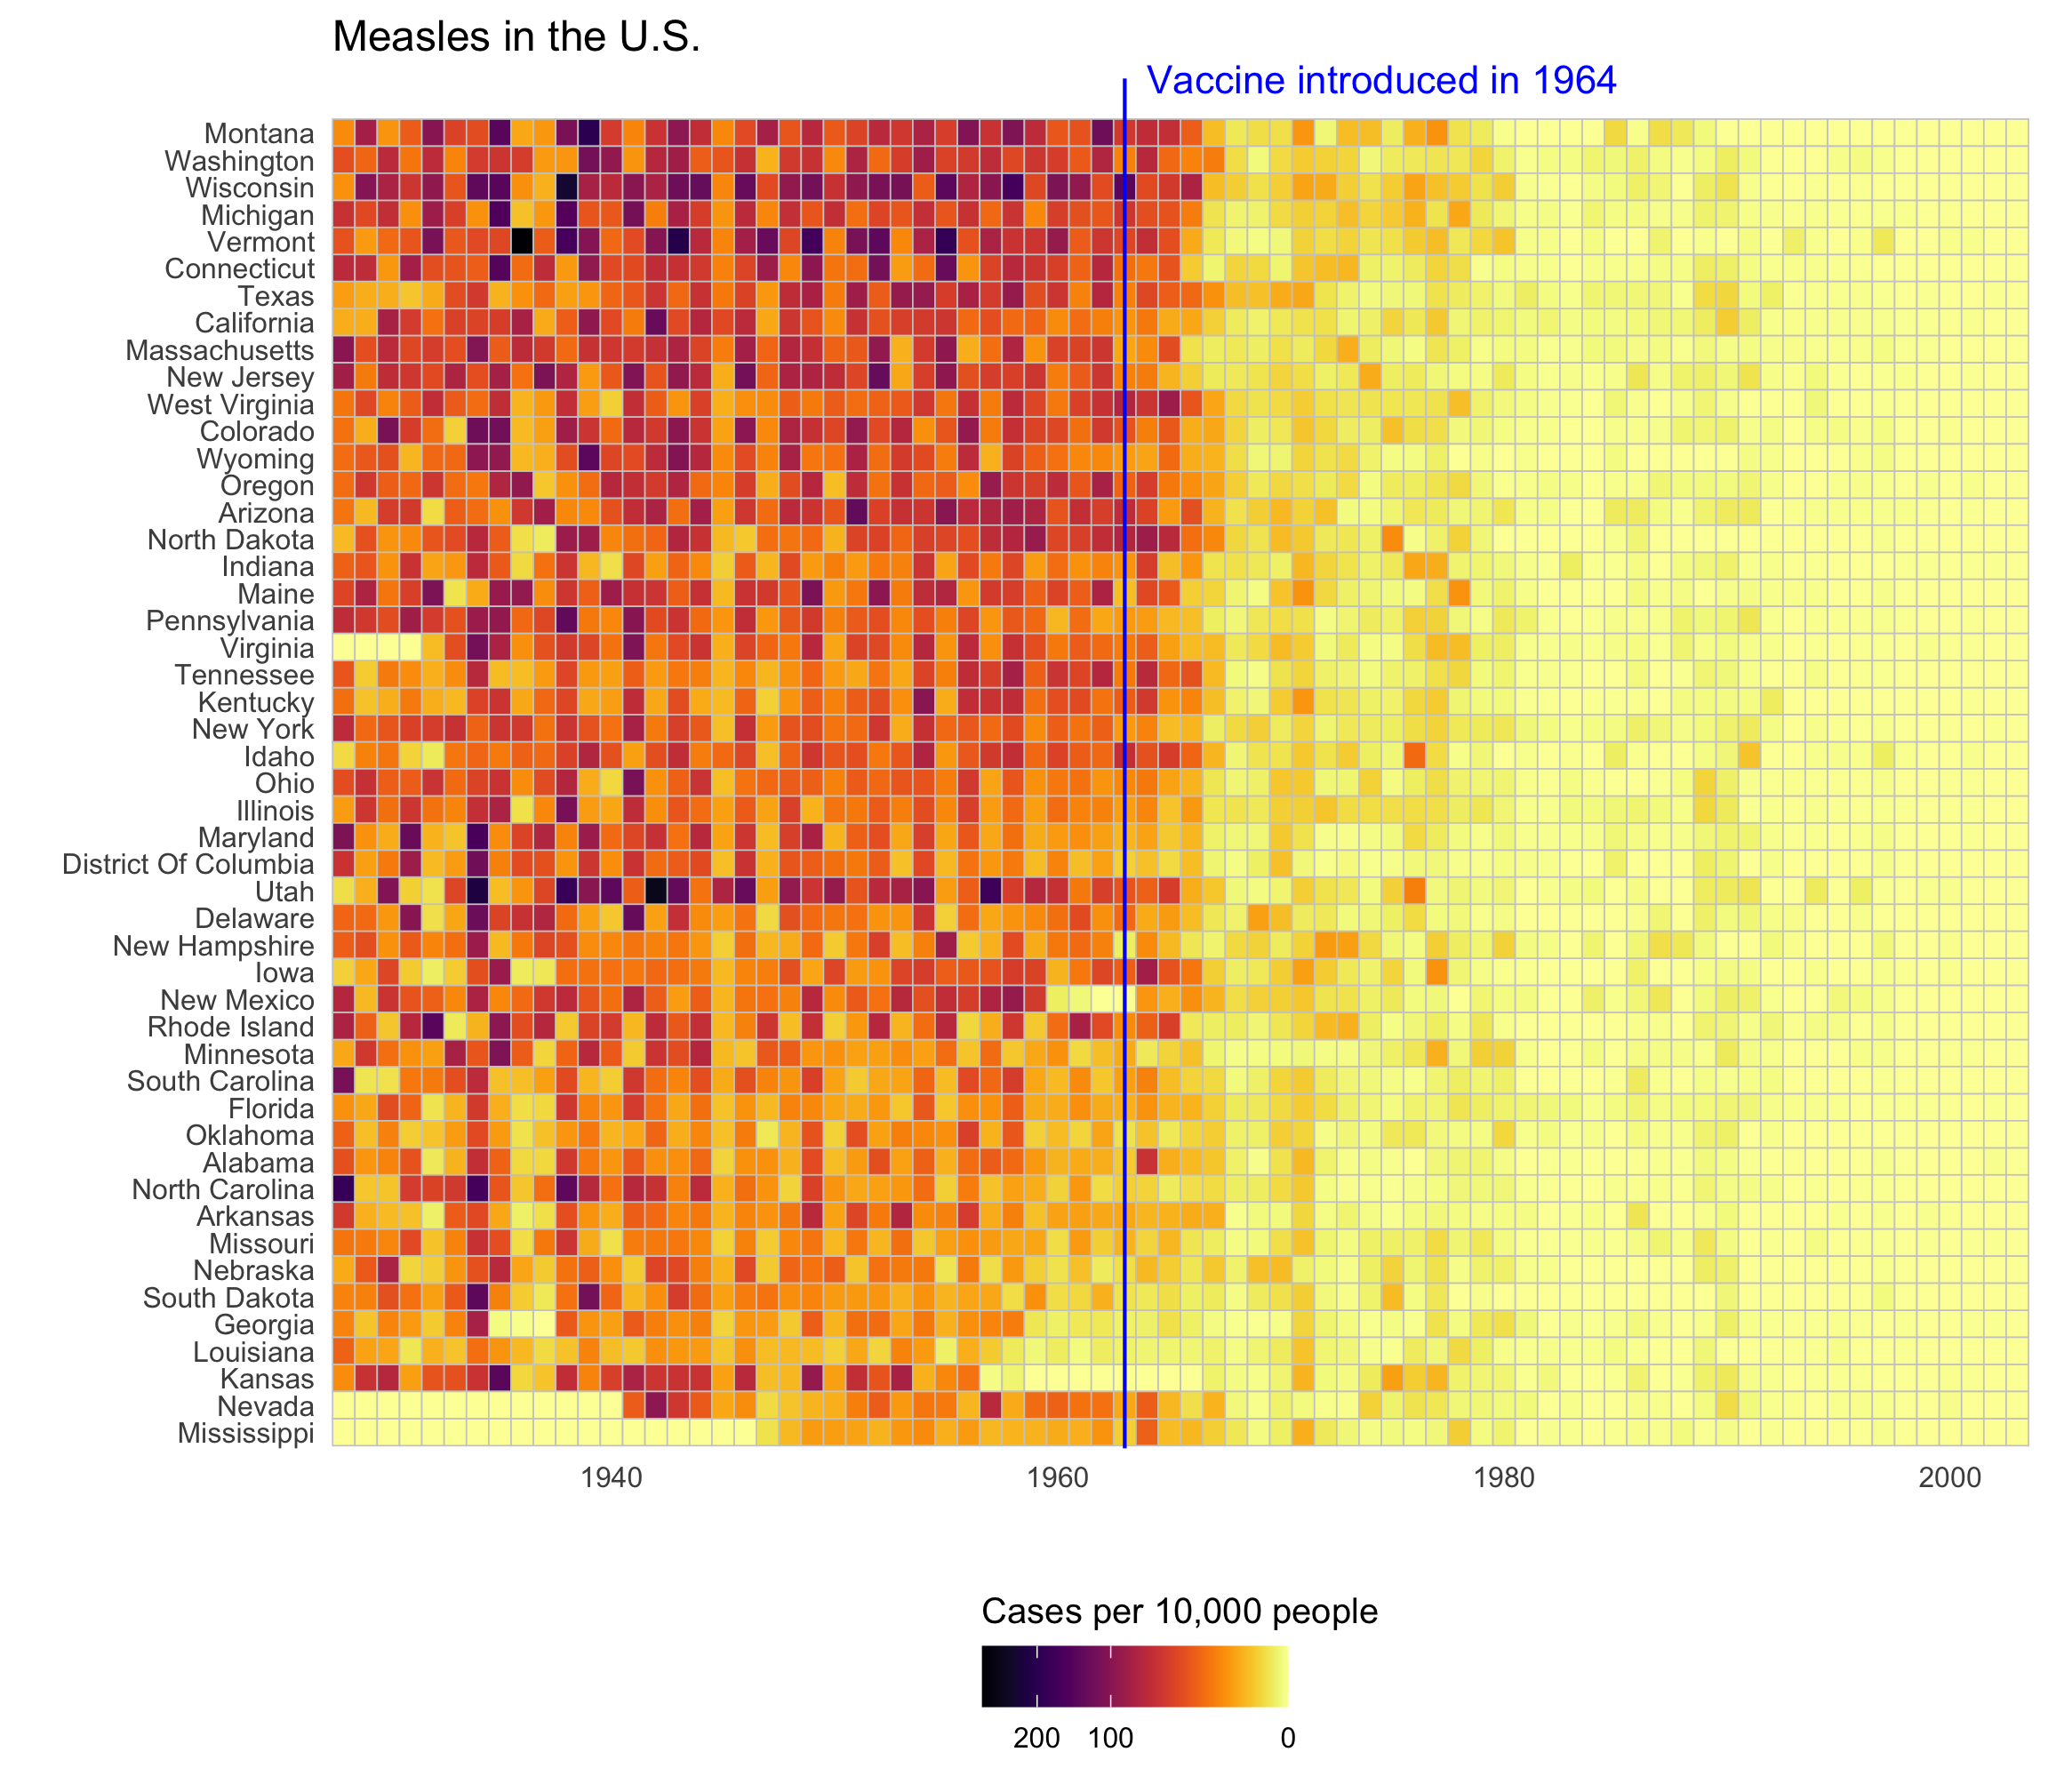
Measles in all 50 states
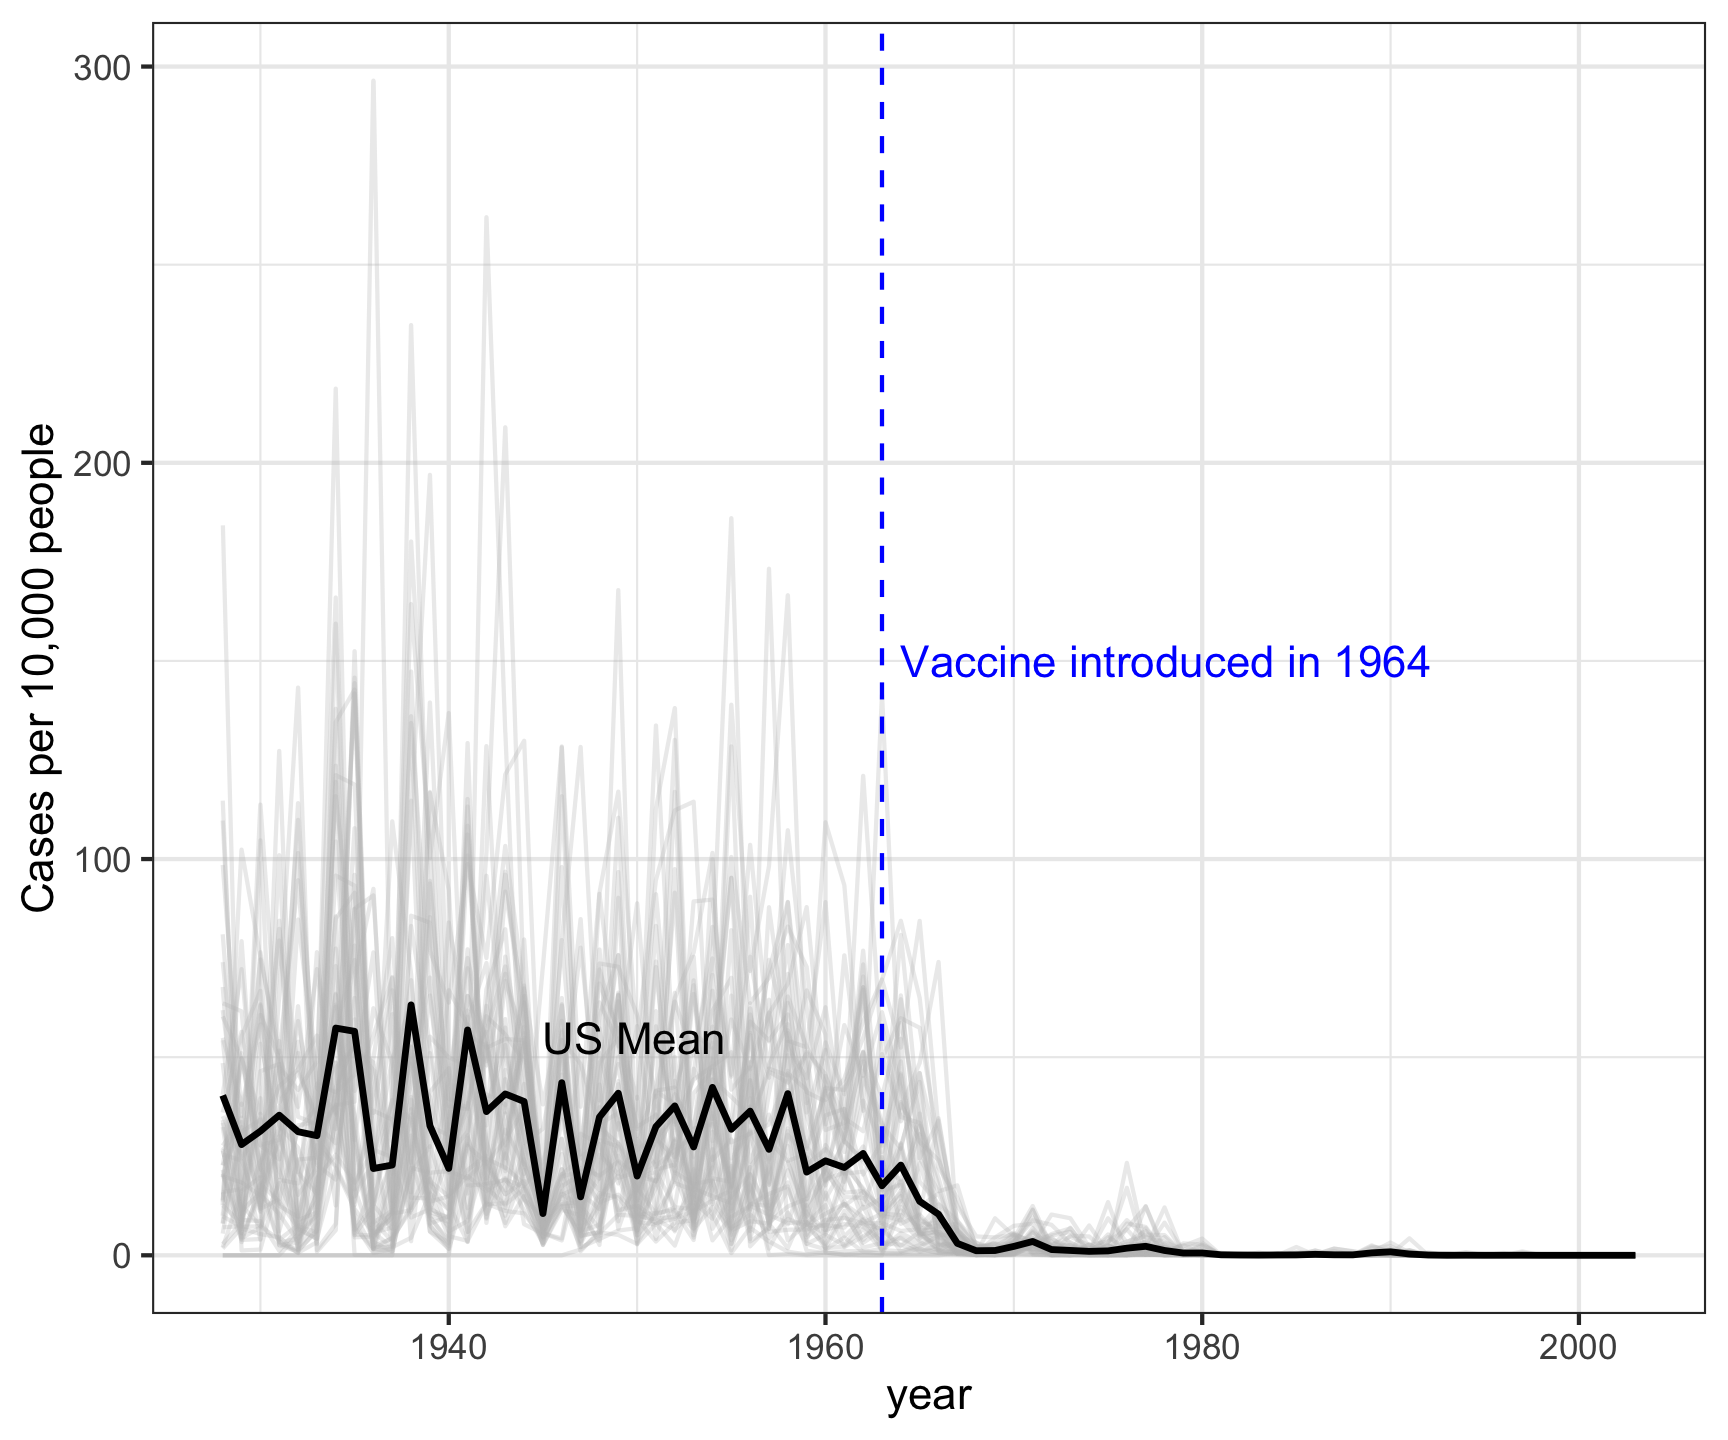
If you have lots of categories:
1) Plot all the data with the average highlighted
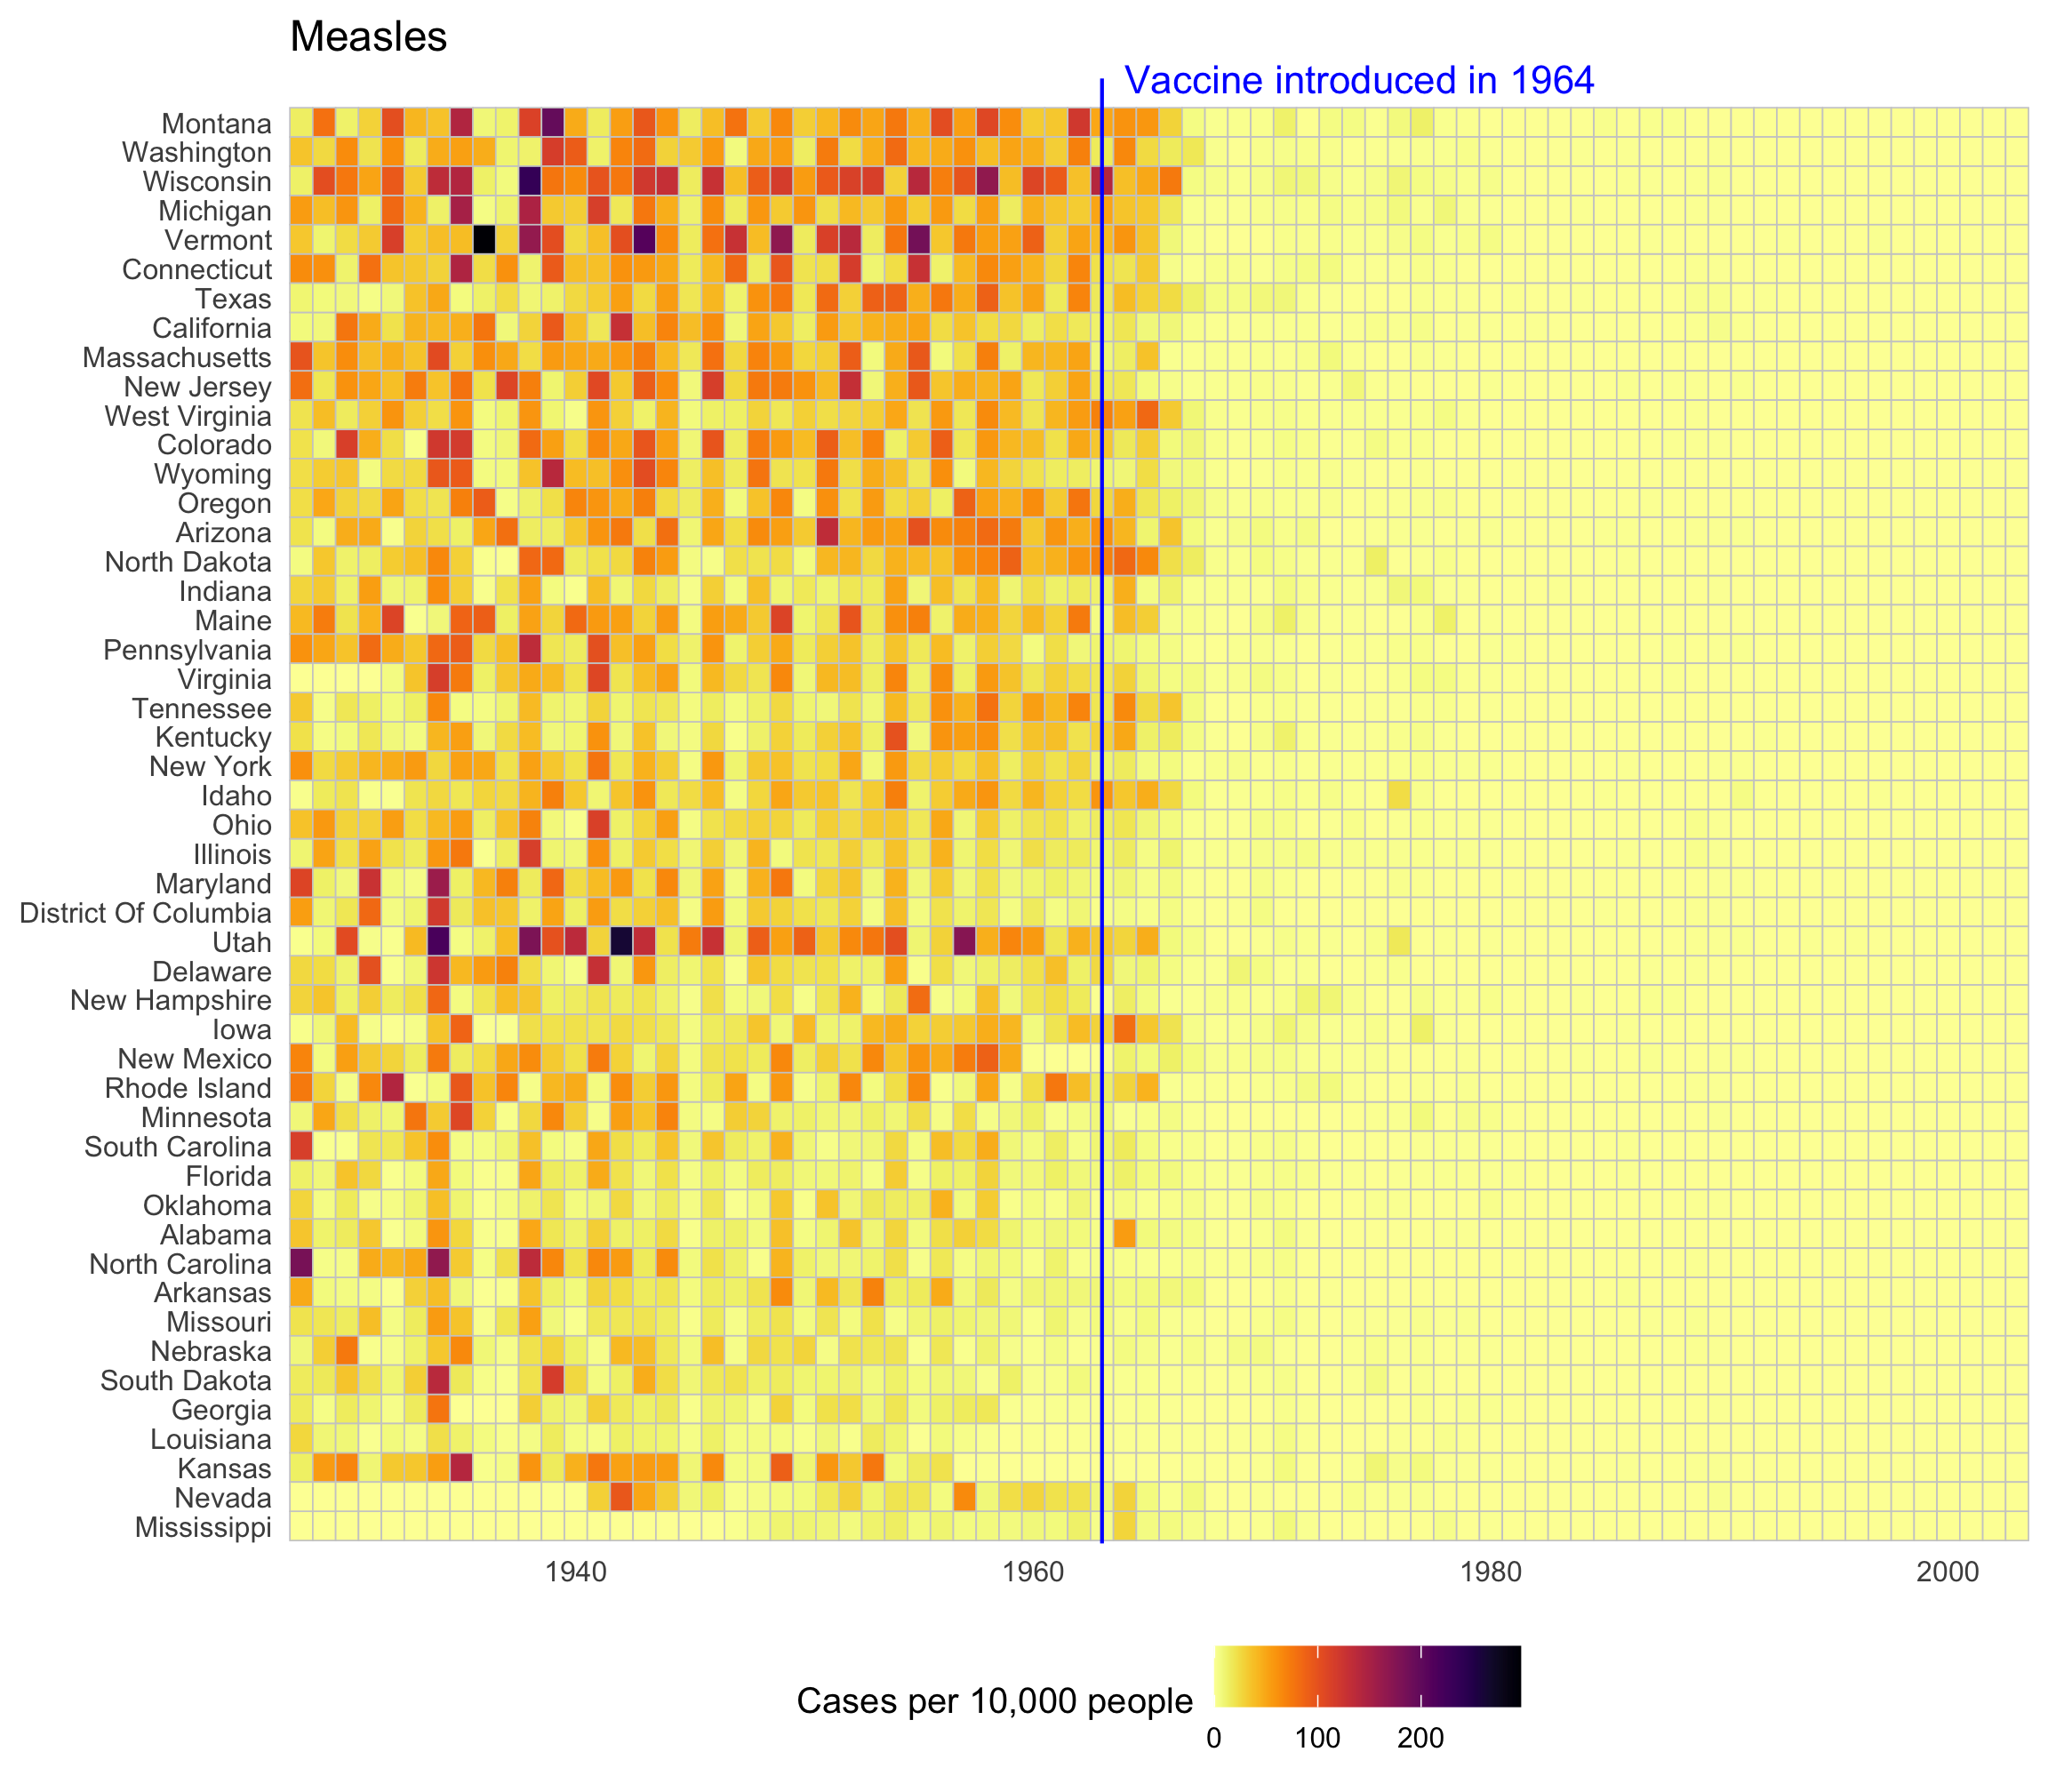
2) Plot all the data with a heat map
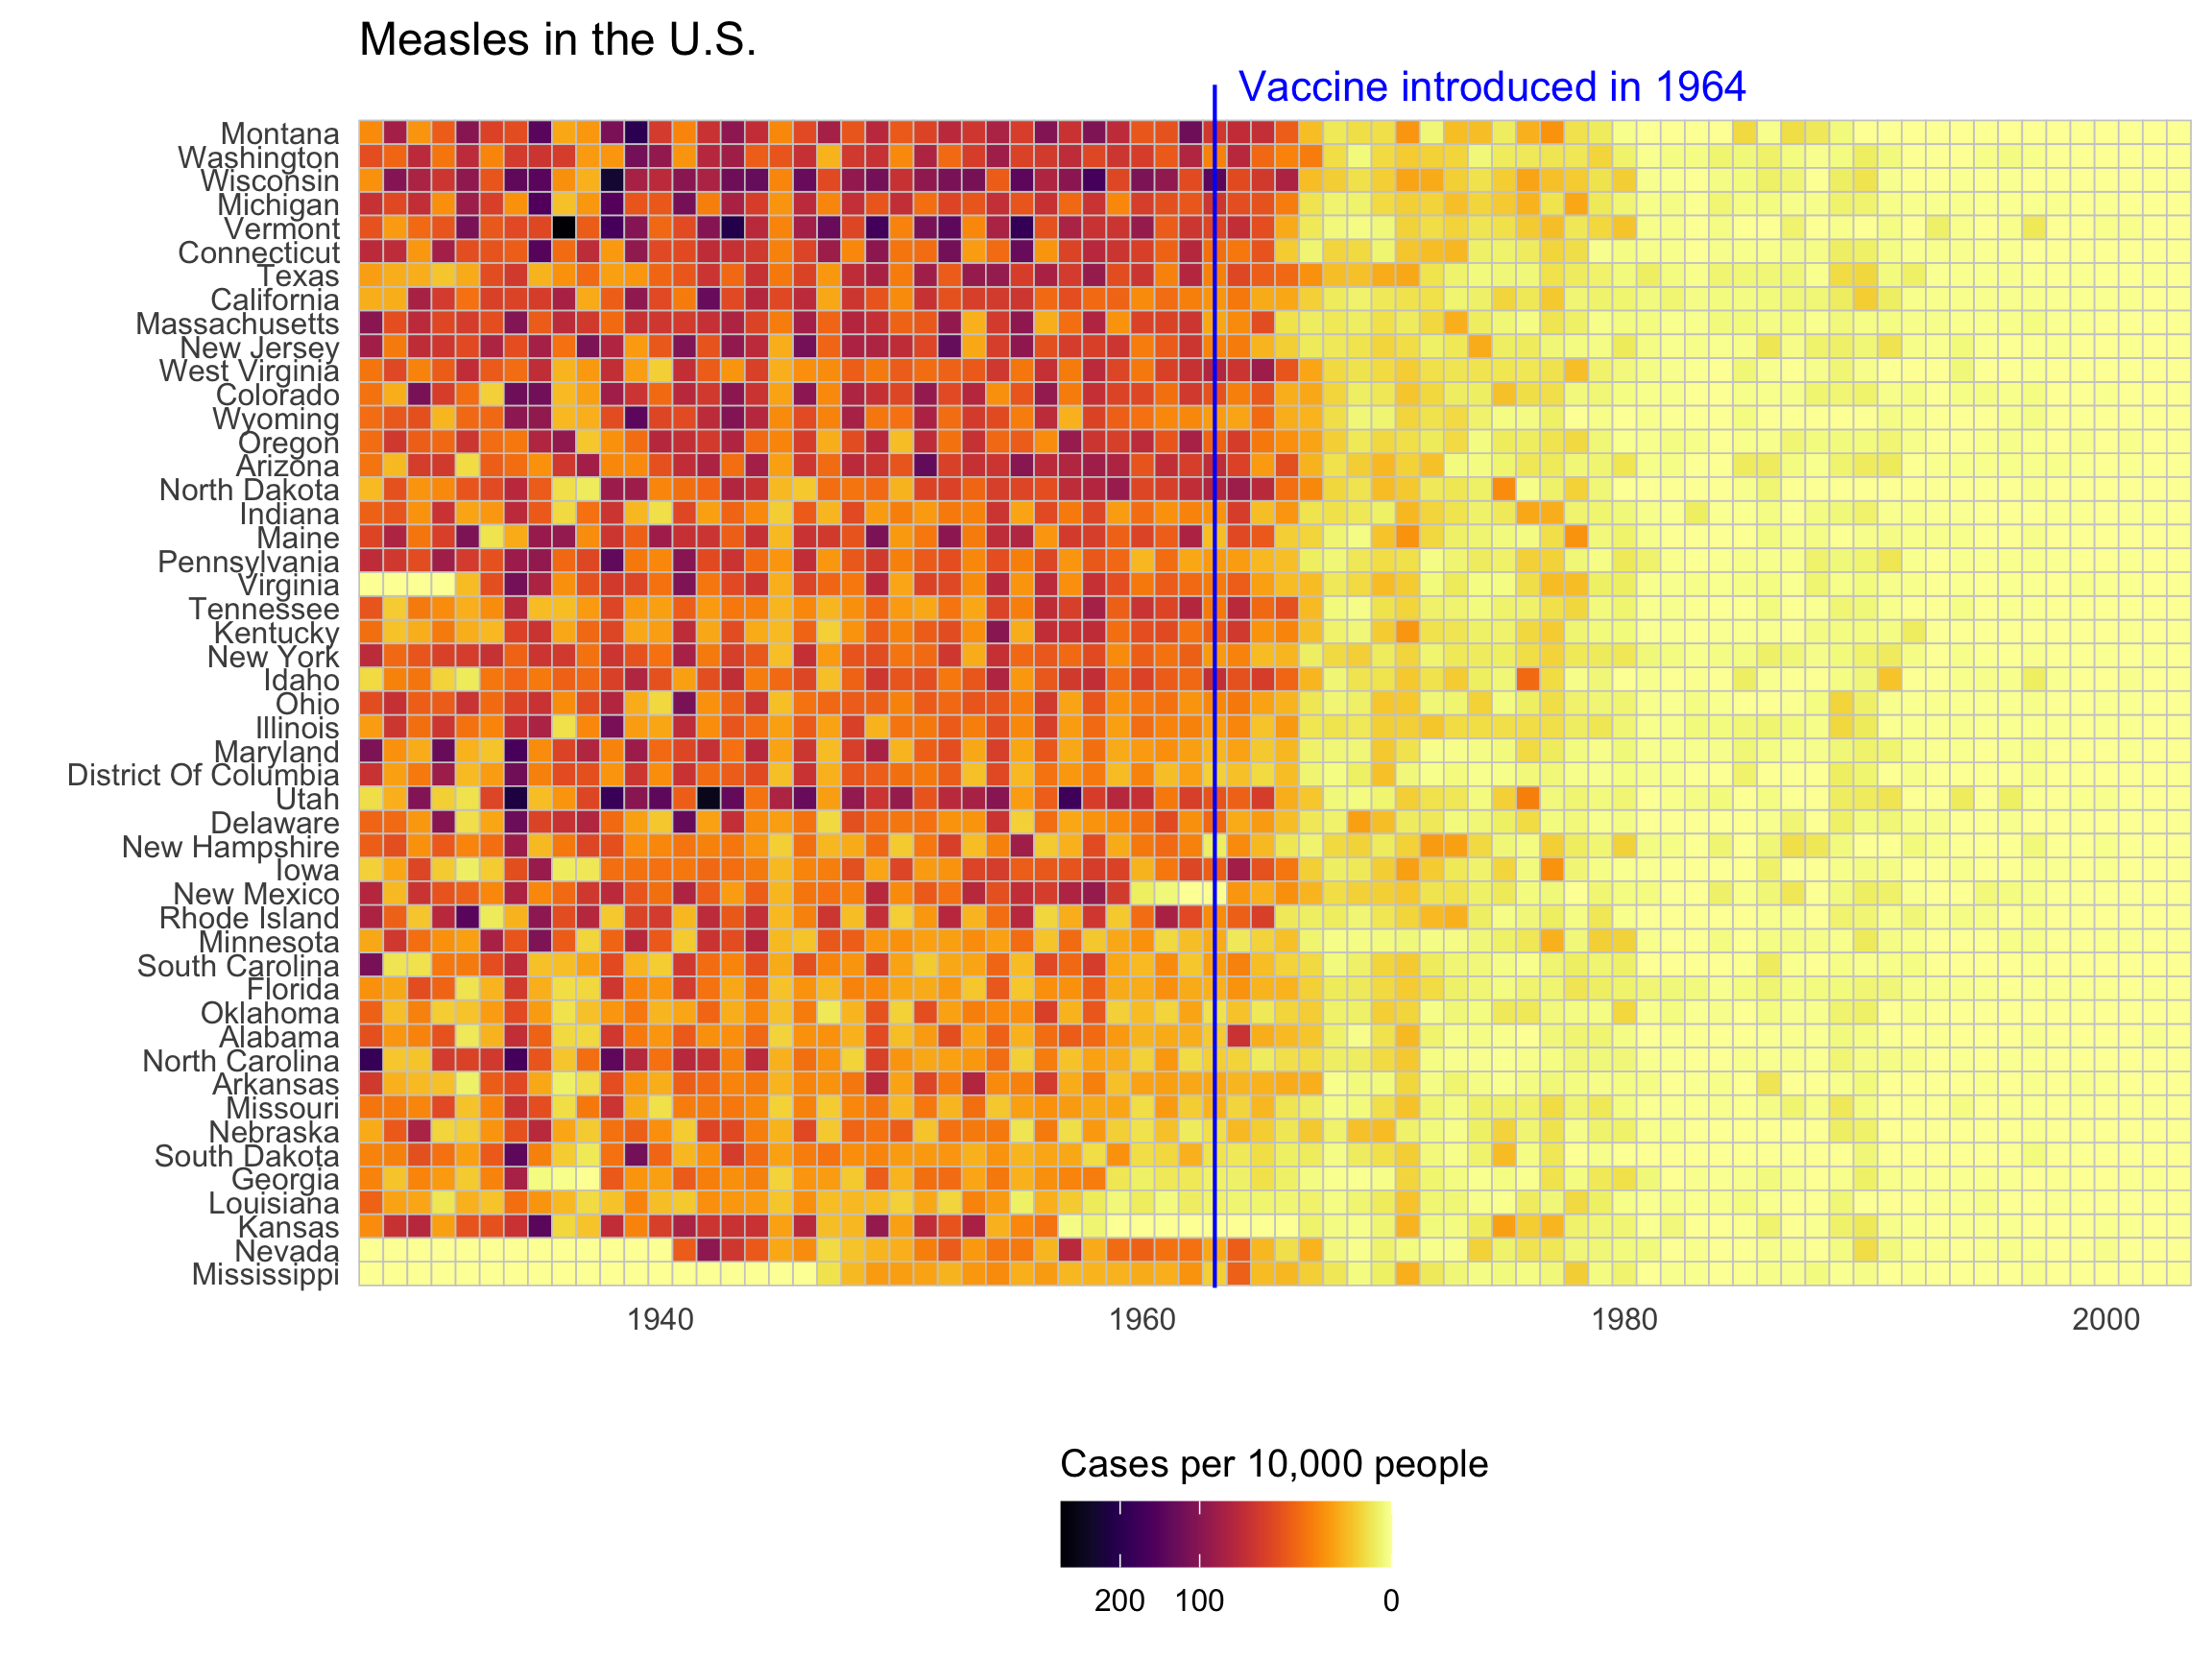
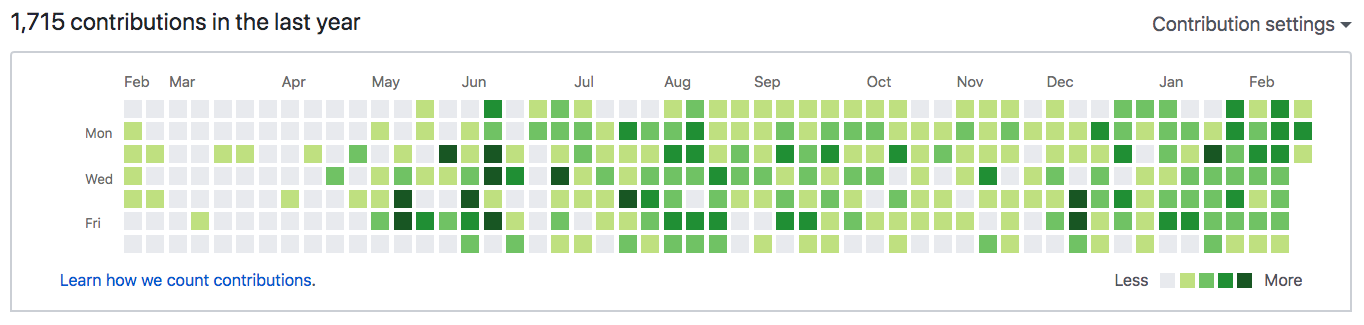
Heatmaps are great for multiple divisions of time
My activity on Github:
Check out this heat map on Traffic fatalities
Make the basic line chart first
# Format the data
milk_region <- milk_production %>%
  filter(
    region %in%
      c('Pacific', 'Northeast', 'Lake States', 'Mountain')
  ) %>%
  group_by(year, region) %>%
  summarise(milk_produced = sum(milk_produced)) %>%
  ungroup()

# Make the line chart
ggplot(
  milk_region,
  aes(x = year, y = milk_produced, color = region)
) +
  geom_line(size = 1) +
  scale_color_manual(
    values = c('sienna', 'forestgreen', 'dodgerblue', 'orange')
  ) +
  theme_half_open(font_size = 18) +
  labs(
    x = 'Year',
    y = 'Milk produced (billion lbs)',
    color = 'Region',
    title = 'Milk production in four US regions'
  )
How to:
Directly label lines
Directly label lines
# Format the data
milk_region <- milk_production %>%
  filter(
    region %in%
      c('Pacific', 'Northeast', 'Lake States', 'Mountain')
  ) %>%
  group_by(year, region) %>%
  summarise(milk_produced = sum(milk_produced)) %>%
  ungroup()

# Make the line plot
ggplot(milk_region, aes(x = year, y = milk_produced, color = region)) +
  geom_line(size = 1) +
  # Add labels
  geom_text_repel(
    data = milk_region %>% filter(year == max(year)),
    aes(label = region),
    hjust = 0,
    nudge_x = 1,
    direction = "y",
    size = 6,
    segment.color = NA
  ) +
  # Create space for labels on right side
  scale_x_continuous(
    breaks = seq(1970, 2010, 10),
    expand = expansion(add = c(1, 13))
  ) +
  scale_color_manual(
    values = c('sienna', 'forestgreen', 'dodgerblue', 'orange')
  ) +
  theme_half_open(font_size = 18) +
  # Remove legend
  theme(legend.position = 'none') +
  labs(
    x = 'Year',
    y = 'Milk produced (billion lbs)',
    title = 'Milk production in four US regions'
  )
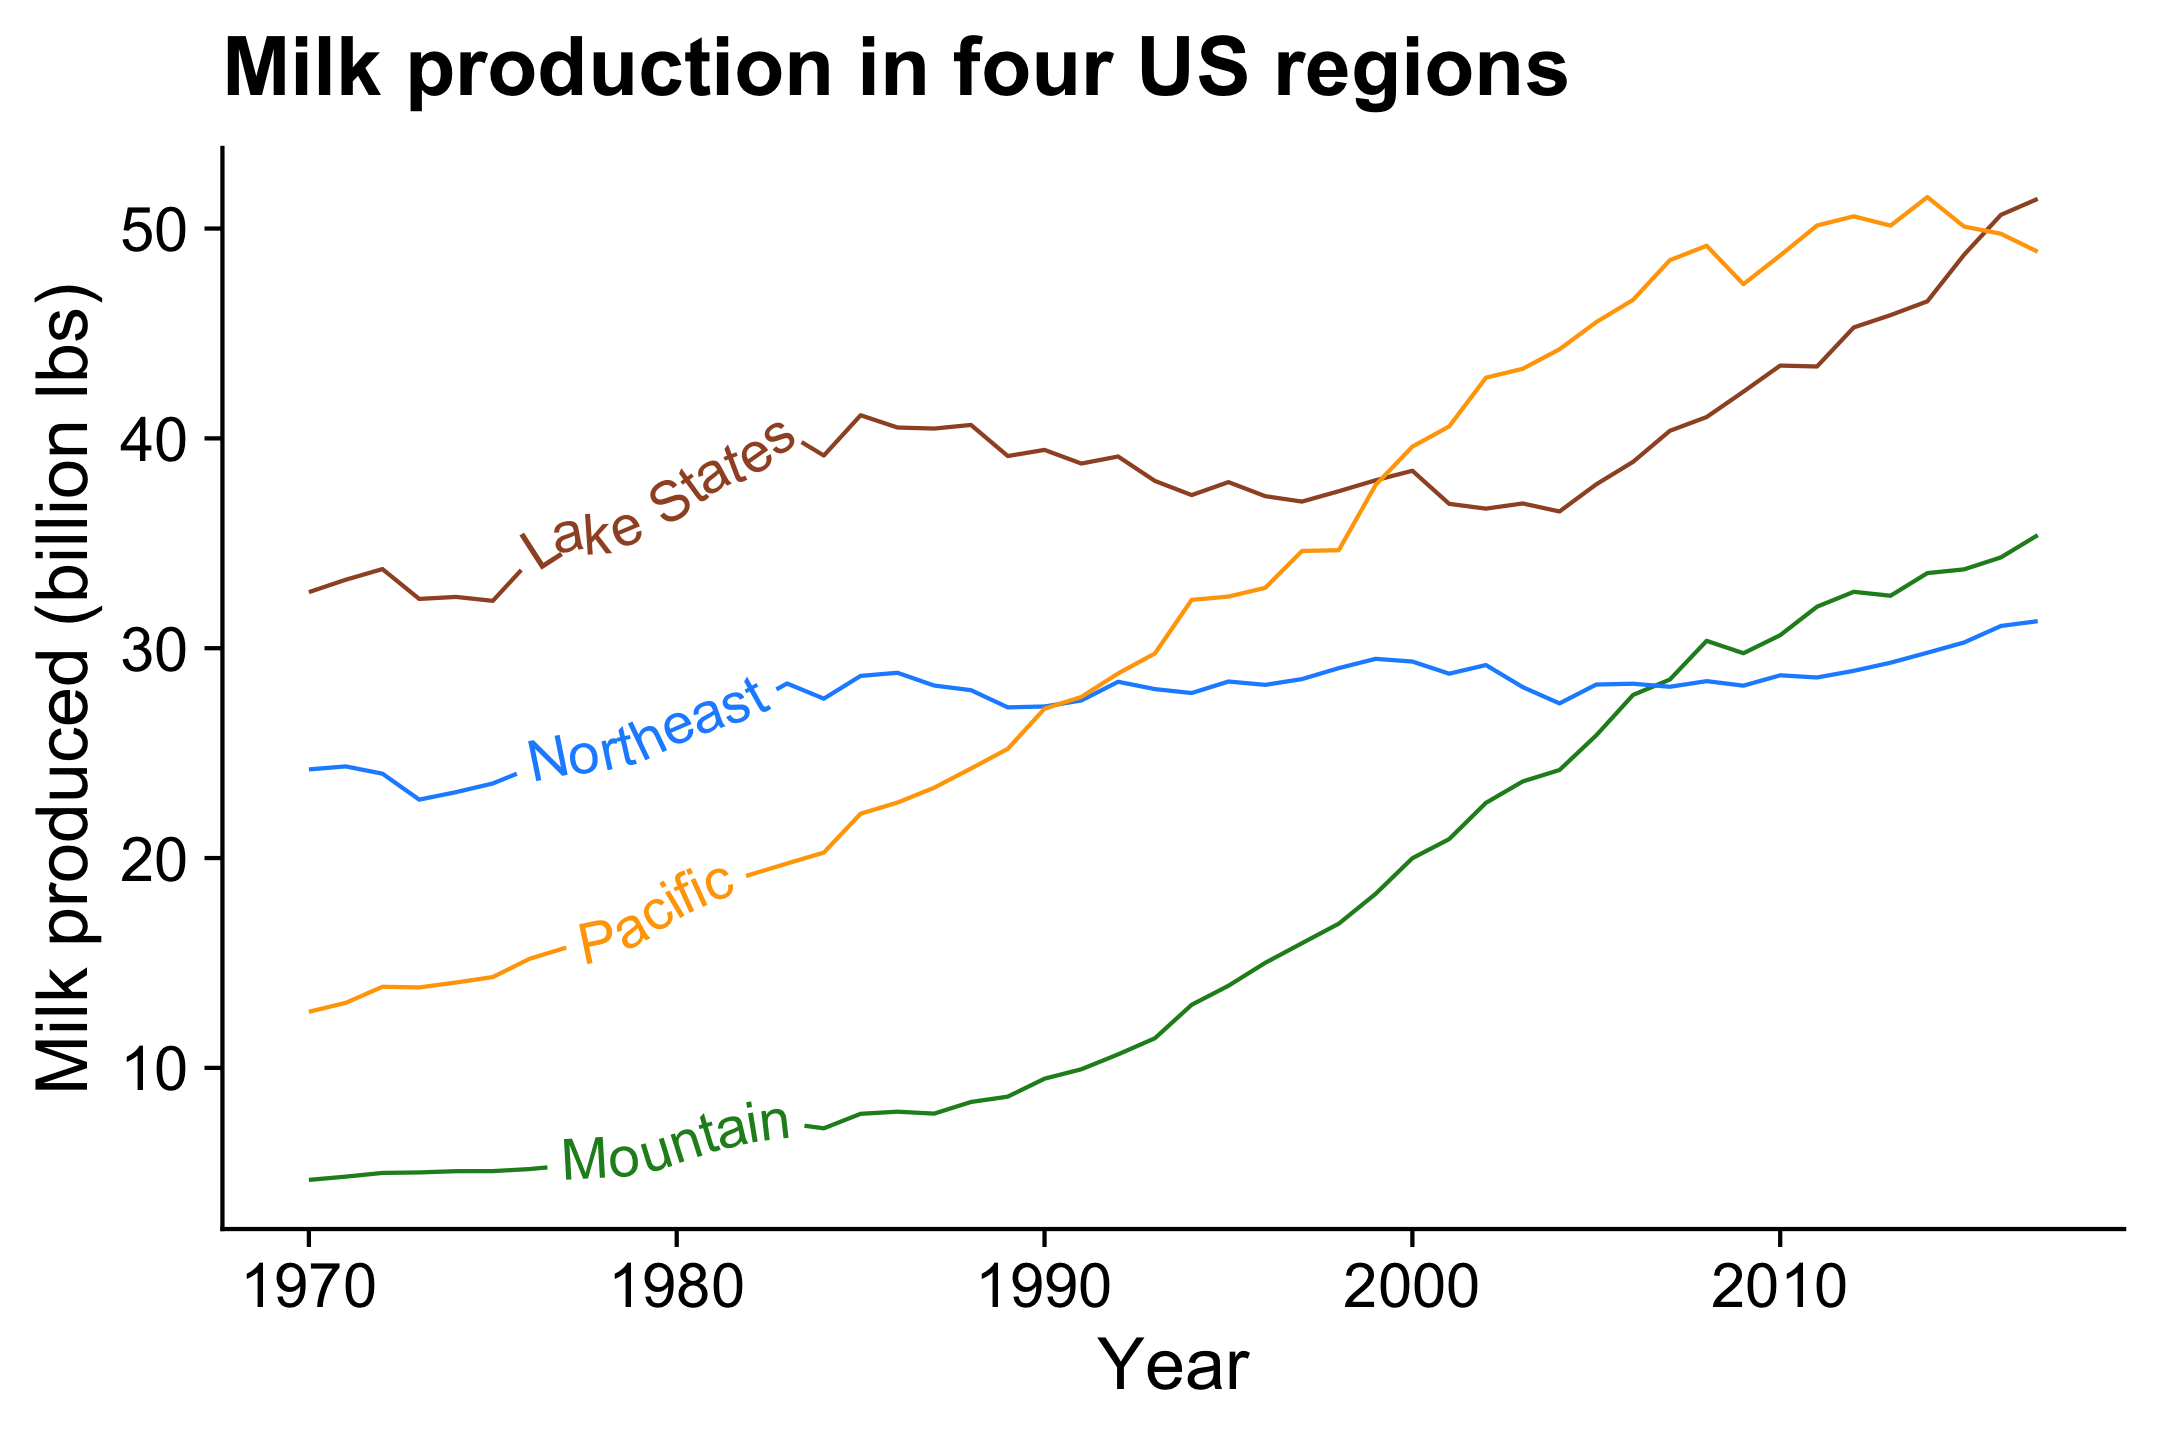
How to:
Directly label lines
Directly label lines
library(geomtextpath)

# Format the data
milk_production %>%
  filter(
    region %in%
      c('Pacific', 'Northeast', 'Lake States', 'Mountain')
  ) %>%
  group_by(year, region) %>%
  summarise(milk_produced = sum(milk_produced)) %>%
  ungroup() %>%

  # Make the line plot
  ggplot() +
  geom_textline(
    aes(
      x = year,
      y = milk_produced,
      color = region,
      label = region,
      group = region
    ),
    size = 5,
    hjust = 0.15
  ) +
  scale_color_manual(
    values = c('sienna', 'forestgreen', 'dodgerblue', 'orange')
  ) +
  theme_half_open(font_size = 18) +
  # Remove legend
  theme(legend.position = 'none') +
  labs(
    x = 'Year',
    y = 'Milk produced (billion lbs)',
    title = 'Milk production in four US regions'
  )
How to: Stacked area
internet_region %>%
  mutate(numUsers = numUsers / 10^9) %>%
  ggplot() +
  geom_area(aes(x = year, y = numUsers, fill = region)) +
  # Nice colors from "viridis" library:
  scale_fill_viridis(discrete = TRUE) +
  # Sort the legend into 3 rows
  guides(
    fill = guide_legend(
      nrow = 3,
      byrow = FALSE
    )
  ) +
  theme_minimal_grid(font_size = 15) +
  theme(legend.position = 'bottom') +
  labs(
    x = 'Year',
    y = NULL,
    fill = 'Region',
    title = 'Number of internet users (billions)'
  )
Format the data
# Format the data
measles <- us_diseases %>%
  filter(
    disease == 'Measles',
    !state %in% c("Hawaii", "Alaska")
  ) %>%
  mutate(
    rate = (count / population) * 10000,
    state = fct_reorder(state, rate)
  ) %>%
  # Compute annual mean rate across all states
  group_by(year) %>%
  mutate(
    mean_rate = sum(count) / sum(population) * 10000
  )
Make all the state lines in light grey color
ggplot(measles) +
    geom_line(
        aes(x = year, y = rate, group = state),
        color = 'grey',
        alpha = 0.3
    ) +
    # Add reference line & label:
    geom_vline(xintercept = 1963, col = 'blue', linetype = 'dashed') +
    annotate(
        'text',
        x = 1964,
        y = 150,
        hjust = 0,
        label = 'Vaccine introduced in 1964',
        color = 'blue'
    ) +
    theme_minimal_grid(font_size = 18) +
    labs(y = 'Cases per 10,000 people')
How to:
Average line overlay
Average line overlay
Now overlay the annual mean line
ggplot(measles) +
  geom_line(
    aes(x = year, y = rate, group = state),
    color = 'grey',
    alpha = 0.3
  ) +
  geom_line(
    aes(x = year, y = mean_rate),
    size = 0.8
  ) +
  # Add US mean label
  annotate(
    'text',
    x = 1945,
    y = 55,
    hjust = 0,
    label = 'US Mean'
  ) +
  # Add reference line & label
  geom_vline(xintercept = 1963, col = 'blue', linetype = 'dashed') +
  annotate(
    'text',
    x = 1964,
    y = 150,
    hjust = 0,
    label = 'Vaccine introduced in 1964',
    color = 'blue'
  ) +
  theme_minimal_grid(font_size = 18) +
  labs(y = 'Cases per 10,000 people')
How to:
Average line overlay
Average line overlay
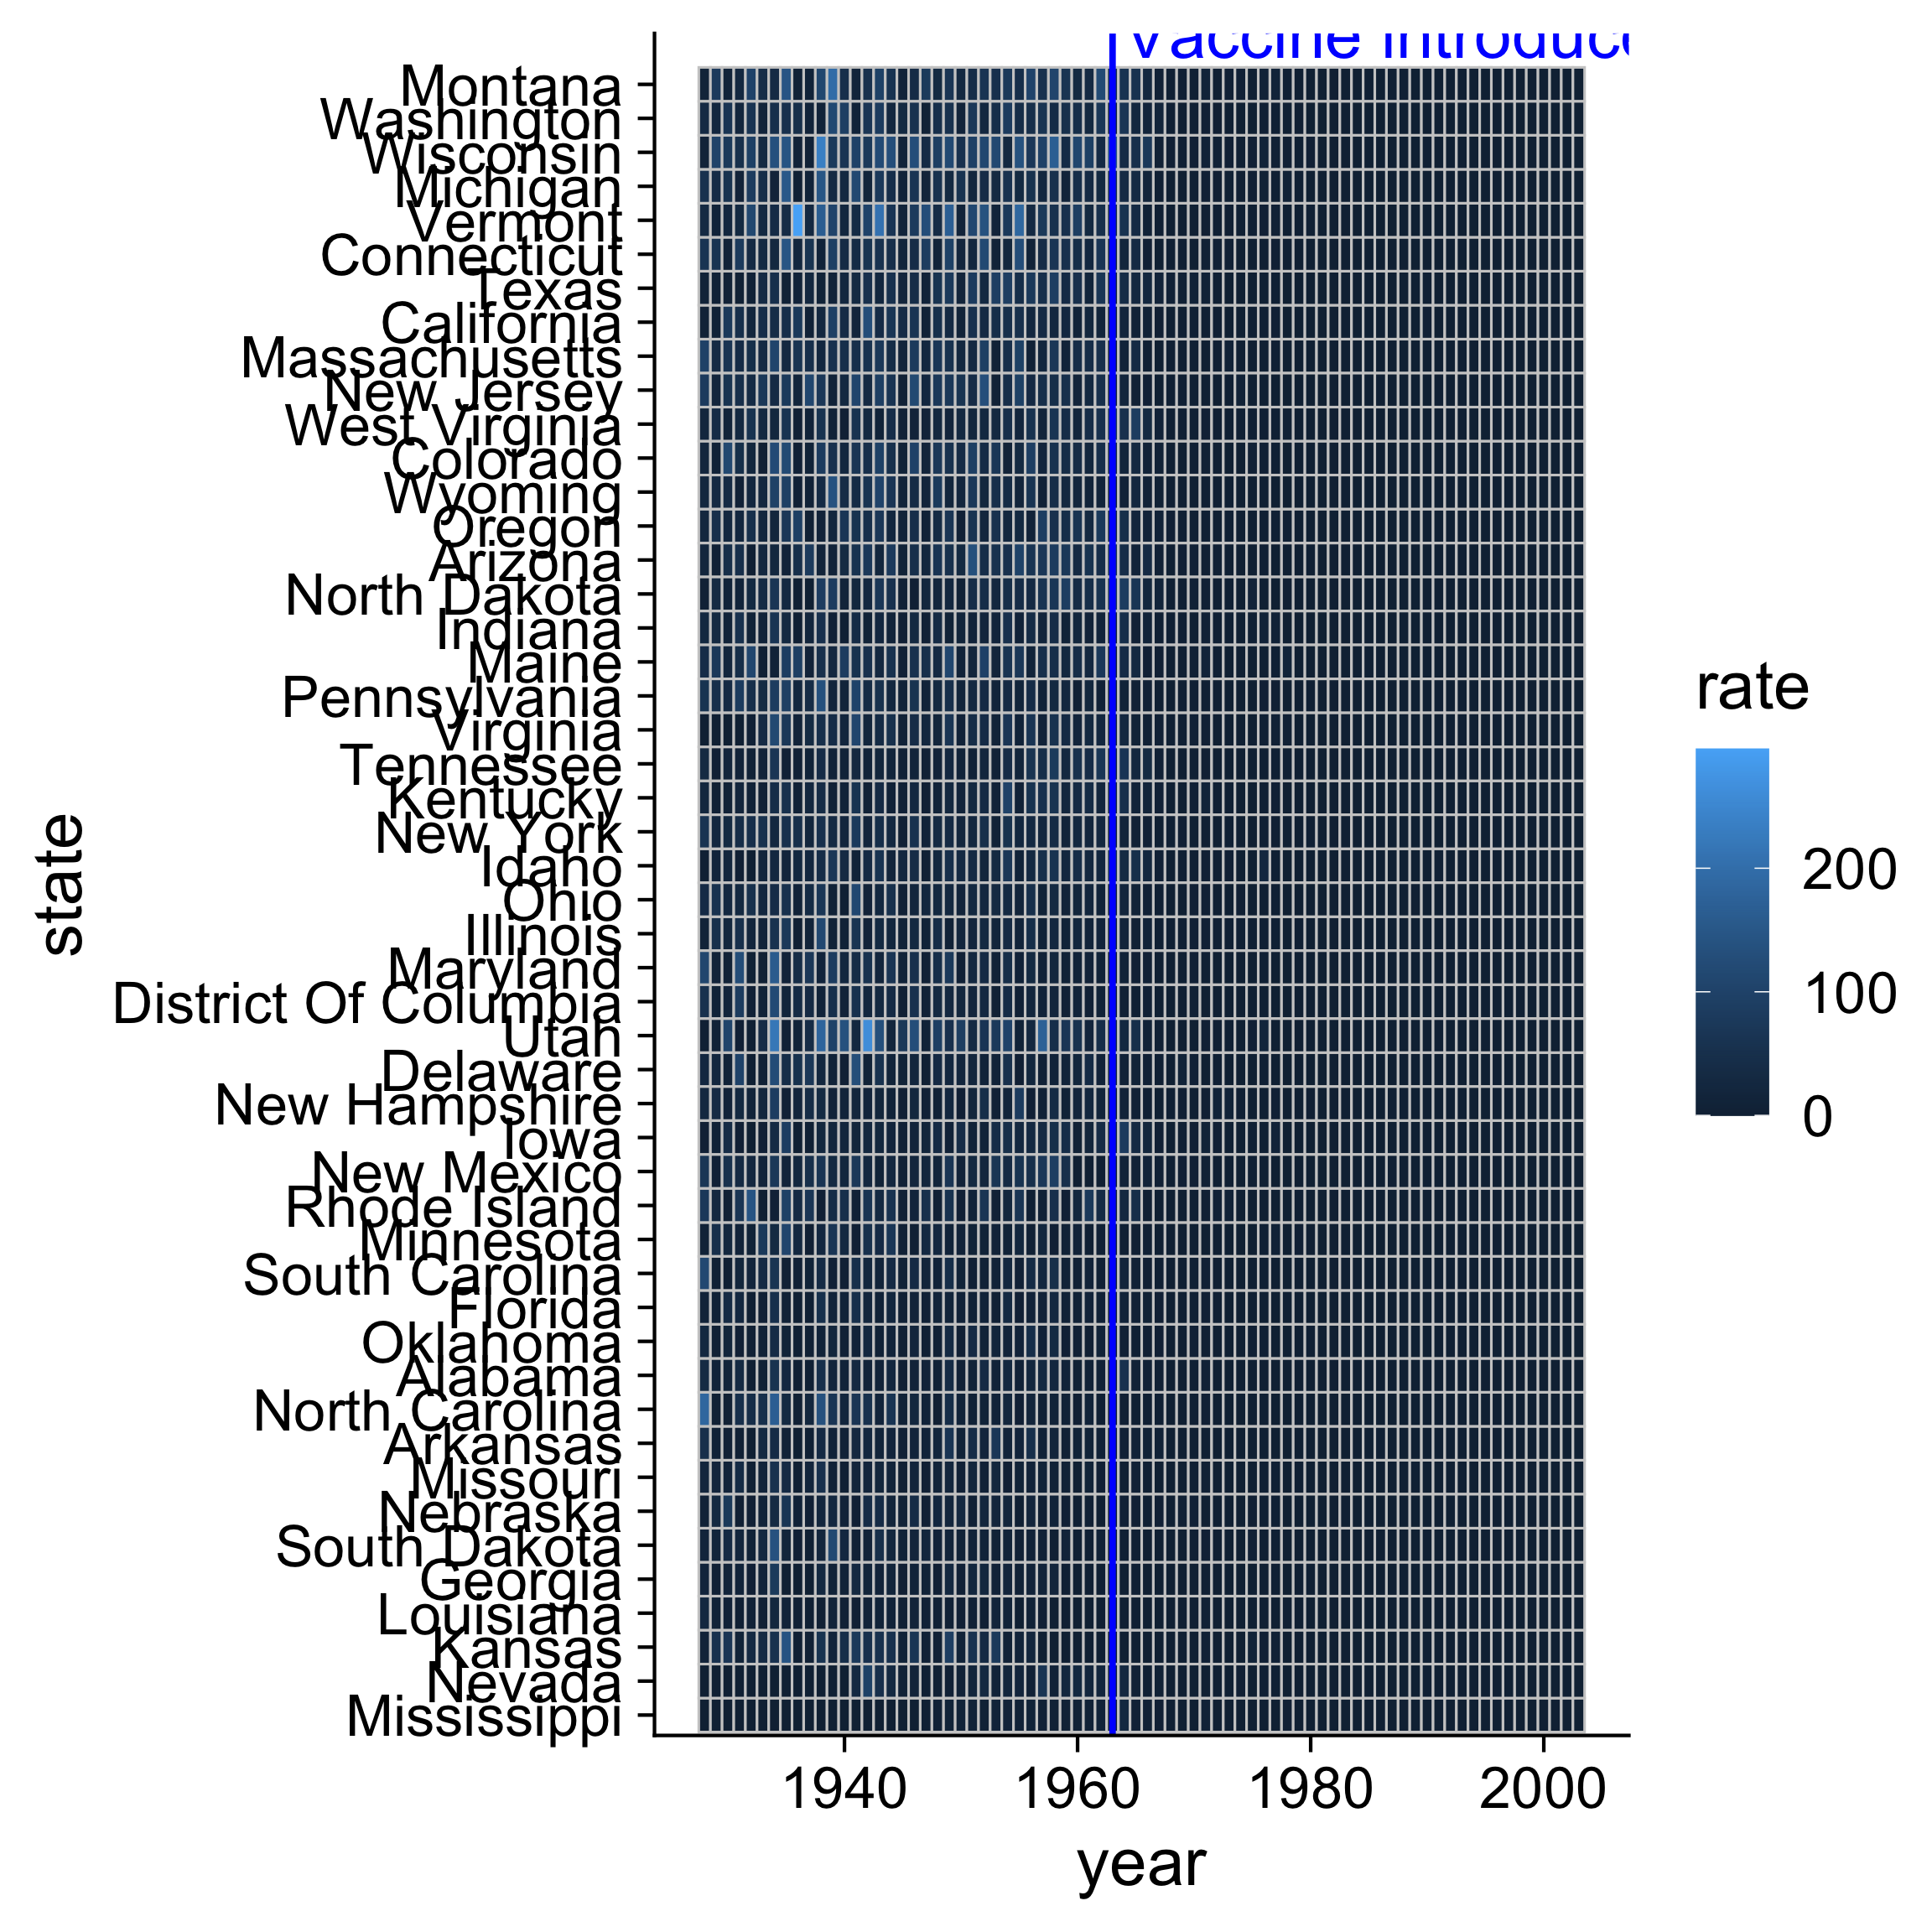
Create main grid with geom_tile()
How to: Heat map
Adjust scales and adjust theme
ggplot(measles) +
  geom_tile(aes(x = year, y = state, fill = rate), color = 'grey80') +
  # Add reference line & label
  geom_vline(xintercept = 1963, col = 'blue') +
  annotate(
    'text',
    x = 1964,
    y = 50.5,
    hjust = 0,
    label = 'Vaccine introduced in 1964',
    color = 'blue'
  ) +
  # Adjust scales
  scale_x_continuous(expand = c(0, 0)) +
  scale_fill_viridis(
    option = 'inferno',
    direction = -1
  ) +
  # Adjust theme
  theme_minimal() +
  theme(
    panel.grid = element_blank(),
    legend.position = 'bottom',
    text = element_text(size = 10)
  ) +
  coord_cartesian(clip = 'off') +
  labs(
    x = NULL,
    y = NULL,
    fill = 'Cases per 10,000 people',
    title = 'Measles'
  )
Color scale is linear in this chart
Adjust scales and adjust theme
ggplot(measles) +
  geom_tile(aes(x = year, y = state, fill = rate), color = 'grey80') +
  # Add reference line & label
  geom_vline(xintercept = 1963, col = 'blue') +
  annotate(
    'text',
    x = 1964,
    y = 50.5,
    hjust = 0,
    label = 'Vaccine introduced in 1964',
    color = 'blue'
  ) +
  # Adjust scales
  scale_x_continuous(expand = c(0, 0)) +
  scale_fill_viridis(
    option = 'inferno',
    direction = -1,
    trans = 'sqrt'
  ) +
  # Modify legend color bar
  guides(
    fill = guide_colorbar(
      title.position = 'top',
      reverse = TRUE
    )
  ) +
  # Adjust theme
  theme_minimal() +
  theme(
    panel.grid = element_blank(),
    legend.position = 'bottom',
    text = element_text(size = 10)
  ) +
  coord_cartesian(clip = 'off') +
  labs(
    x = NULL,
    y = NULL,
    fill = 'Cases per 10,000 people',
    title = 'Measles'
  )
Non-linear color scale
helps with large variations
helps with large variations
Seasonal chart

Source: http://r-statistics.co/Top50-Ggplot2-Visualizations-MasterList-R-Code.html#Seasonal%20Plot
Sankey chart

Source: https://flowcharts.llnl.gov/
Would you consider purchasing an electric car?
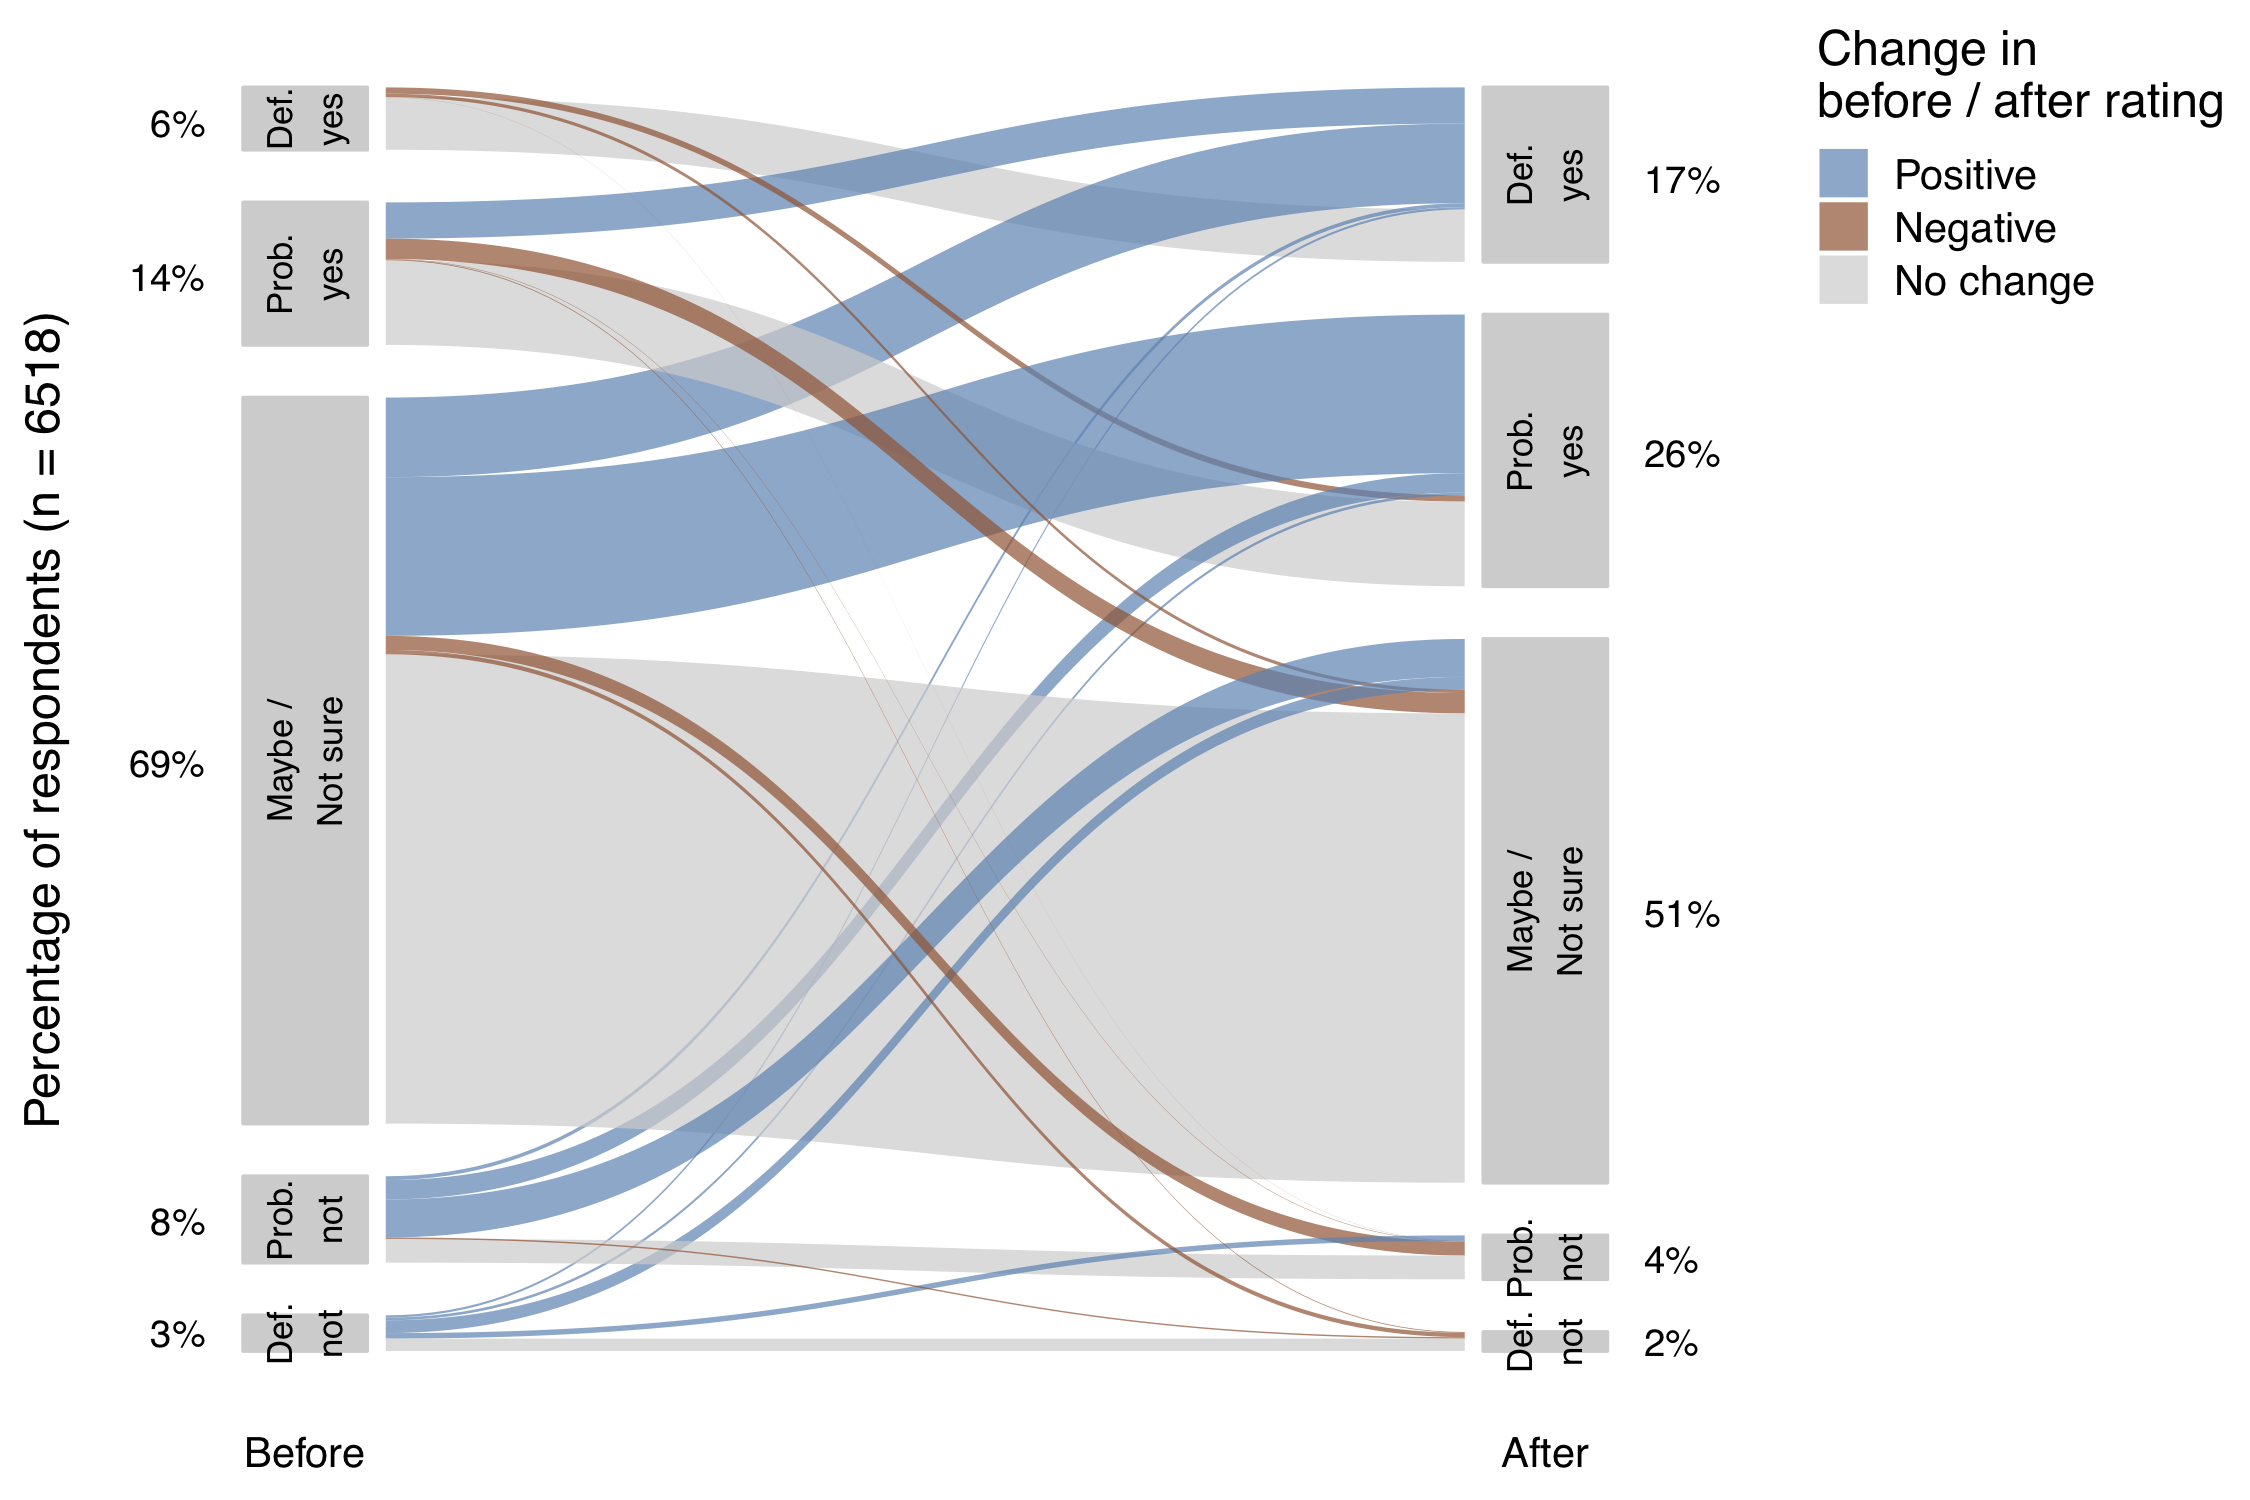
Roberson, Laura A. & Helveston, J.P. (2020) “Electric vehicle adoption: can short experiences lead to big change?,” Environmental Research Letters. 15(0940c3).
Made using the ggforce package