Factors, Amounts, & Proportions
EMSE 4572/6572: Exploratory Data Analysis
John Paul Helveston
October 14, 2026
Quiz 3
Write your name on the quiz!
Rules:
- Work alone; no outside help of any kind is allowed.
- No calculators, no notes, no books, no computers, no phones.

Sorting in ggplot is done by reordering factors


Two ways to sort
Method 1: Use reorder() inside aesthetic mapping
# Format the data frame
federal_spending %>%
  group_by(department) %>%
  summarise(
    rd_budget_bil = sum(rd_budget_mil) / 10^3
  ) %>%

  # Make the chart
  ggplot() +
  geom_col(
    aes(
      x = rd_budget_bil,
      y = reorder(department, rd_budget_bil)
    ),
    width = 0.7,
    alpha = 0.8,
    fill = "steelblue"
  ) +
  scale_x_continuous(
    expand = expansion(mult = c(0, 0.05))
  ) +
  theme_minimal_vgrid()
Two ways to sort
Method 2: Use fct_reorder() when formatting the data frame
# Format the data frame
federal_spending %>%
  group_by(department) %>%
  summarise(
    rd_budget_bil = sum(rd_budget_mil) / 10^3
  ) %>%
  mutate(
    department = fct_reorder(department, rd_budget_bil)
  ) %>%
  # Make the chart
  ggplot() +
  geom_col(
    aes(x = rd_budget_bil, y = department),
    width = 0.7,
    alpha = 0.8,
    fill = "steelblue"
  ) +
  scale_x_continuous(
    expand = expansion(mult = c(0, 0.05))
  ) +
  theme_minimal_vgrid()
Reorder & modify factors with
the forcats library
the forcats library
Loaded with library(tidyverse)

1. Reorder factors based on another numerical variable
Use fct_reorder()
# Format the data frame
federal_spending %>%
  group_by(department) %>%
  summarise(
    rd_budget_bil = sum(rd_budget_mil) / 10^3
  ) %>%
  mutate(
    department = fct_reorder(department, rd_budget_bil)
  ) %>%
  # Make the chart
  ggplot() +
  geom_col(
    aes(x = rd_budget_bil, y = department),
    width = 0.7,
    alpha = 0.8,
    fill = "steelblue"
  ) +
  scale_x_continuous(
    expand = expansion(mult = c(0, 0.05))
  ) +
  theme_minimal_vgrid()
2. Reorder factors manually
# Format the data frame
lotr_words %>%
  pivot_longer(
    names_to = 'gender',
    values_to = 'wordCount',
    cols = Female:Male
  ) %>%

  # Make the chart
  ggplot() +
  geom_col(
    aes(x = wordCount, y = Film),
    width = 0.7,
    alpha = 0.8
  ) +
  scale_x_continuous(
    expand = expansion(mult = c(0, 0.05))
  ) +
  theme_minimal_vgrid()
2. Reorder factors manually with fct_relevel()
# Format the data frame
lotr_words %>%
  pivot_longer(
    names_to = 'gender',
    values_to = 'wordCount',
    cols = Female:Male
  ) %>%
  mutate(
    Film = fct_relevel(
      Film,
      levels = c(
        'The Fellowship Of The Ring',
        'The Two Towers',
        'The Return Of The King'
      )
    )
  ) %>%

  # Make the chart
  ggplot() +
  geom_col(
    aes(x = wordCount, y = Film),
    width = 0.7,
    alpha = 0.8
  ) +
  scale_x_continuous(
    expand = expansion(mult = c(0, 0.05))
  ) +
  theme_minimal_vgrid()
3. Modify factors manually
# Format the data frame
lotr_words %>%
  pivot_longer(
    names_to = 'gender',
    values_to = 'wordCount',
    cols = Female:Male
  ) %>%

  # Make the chart
  ggplot() +
  geom_col(
    aes(x = wordCount, y = Film),
    width = 0.7,
    alpha = 0.8
  ) +
  scale_x_continuous(
    expand = expansion(mult = c(0, 0.05))
  ) +
  theme_minimal_vgrid()
The film names here are too long
3. Modify factors manually with fct_recode()
"new label" = "old label"
# Format the data frame
lotr_words %>%
  pivot_longer(
    names_to = 'gender',
    values_to = 'wordCount',
    cols = Female:Male
  ) %>%
  mutate(
    Film = fct_recode(
      Film,
      'The Fellowship\nof the Ring' = 'The Fellowship Of The Ring',
      'The Return\nof the King' = 'The Return Of The King'
    )
  ) %>%

  # Make the chart
  ggplot() +
  geom_col(
    aes(x = wordCount, y = Film),
    width = 0.7,
    alpha = 0.8
  ) +
  scale_x_continuous(
    expand = expansion(mult = c(0, 0.05))
  ) +
  theme_minimal_vgrid()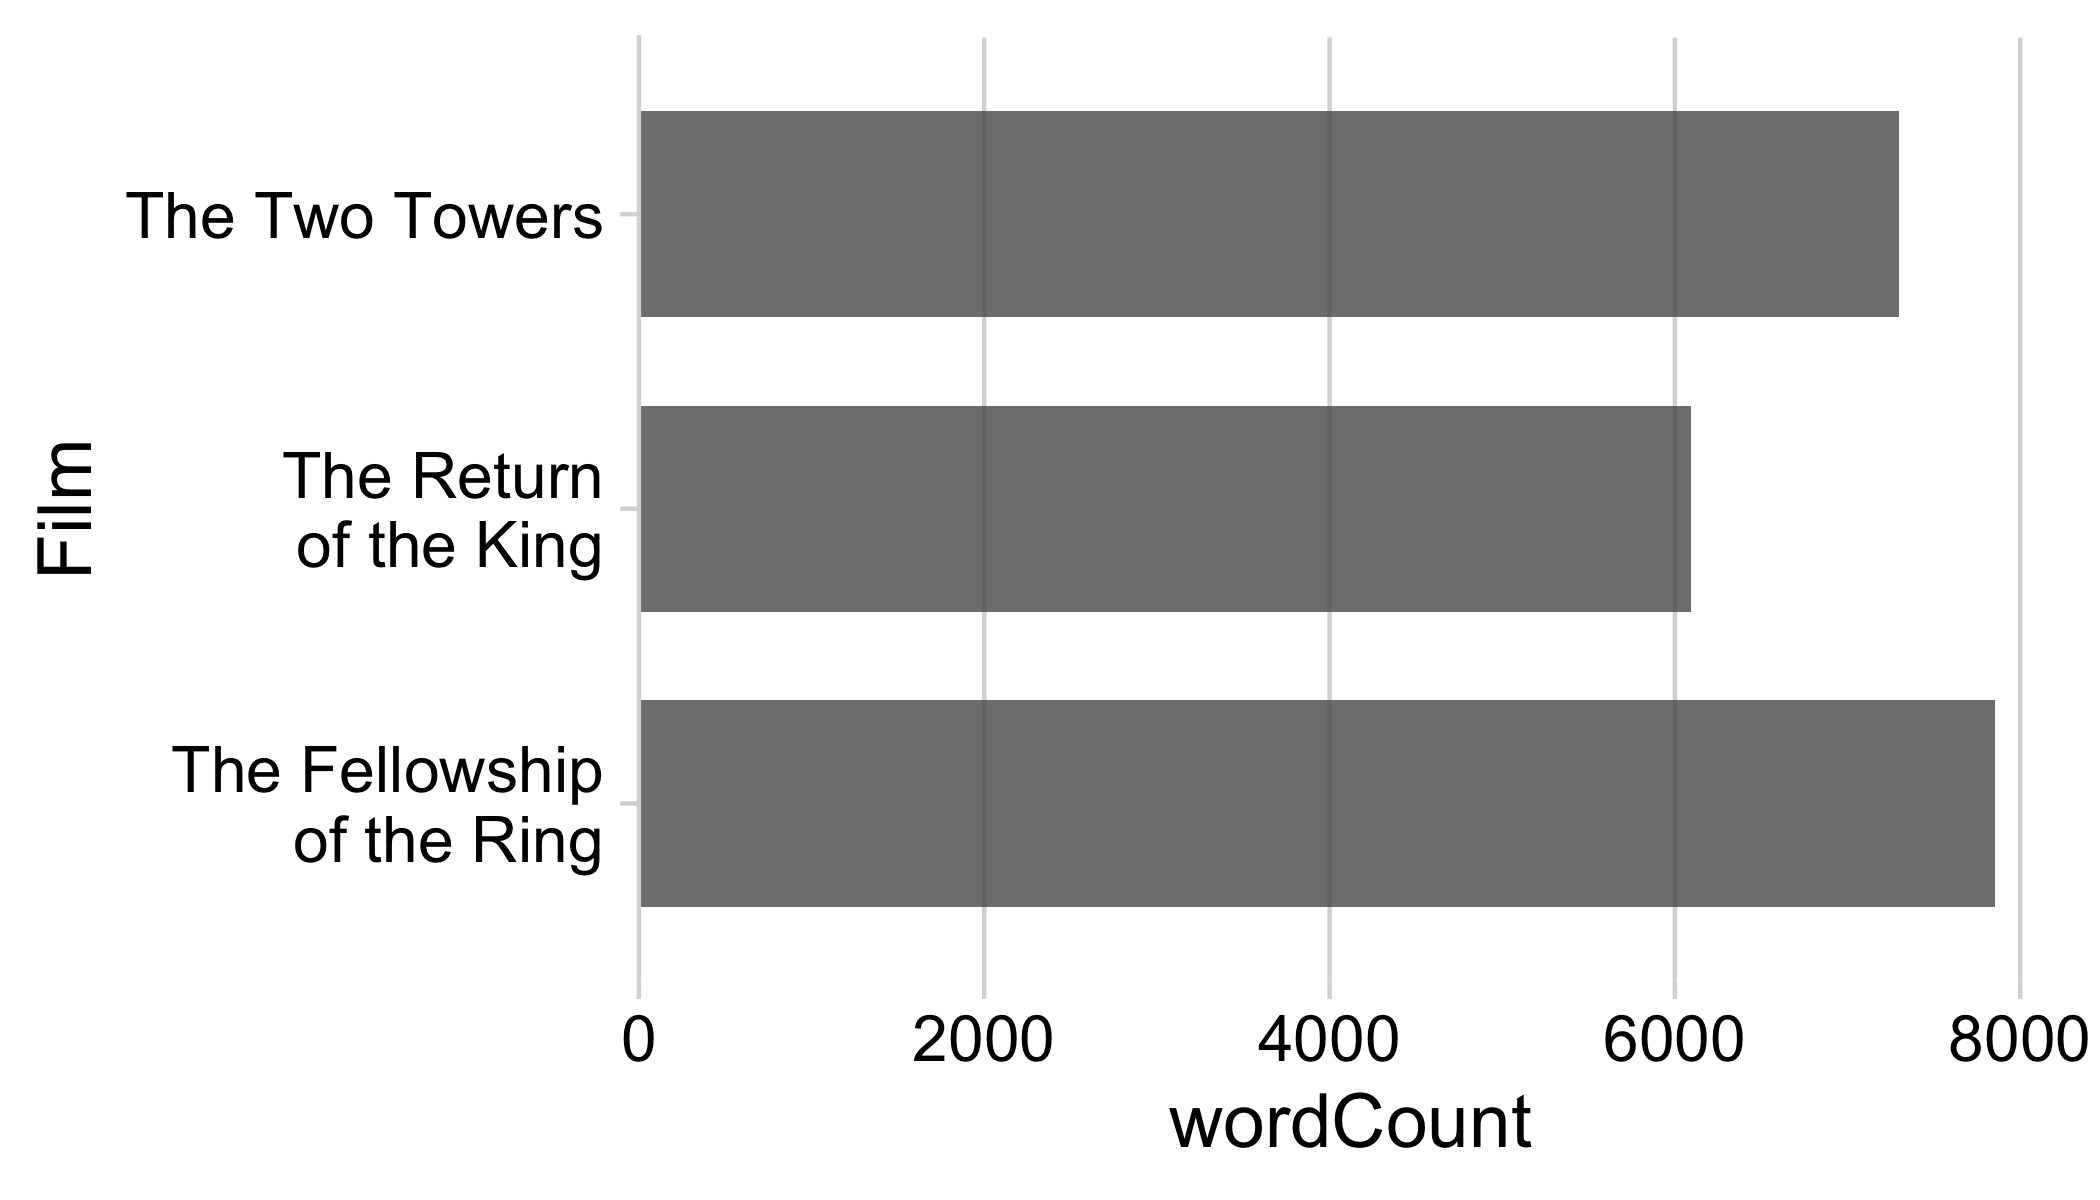
2 & 3. Modify and reorder factors manually
# Format the data frame
lotr_words %>%
  pivot_longer(
    names_to = 'gender',
    values_to = 'wordCount',
    cols = Female:Male
  ) %>%
  mutate(
    Film = fct_relevel(
      Film,
      levels = c(
        'The Fellowship Of The Ring',
        'The Two Towers',
        'The Return Of The King'
      )
    ),
    Film = fct_recode(
      Film,
      'The Fellowship\nof the Ring' = 'The Fellowship Of The Ring',
      'The Return\nof the King' = 'The Return Of The King'
    )
  ) %>%

  # Make the chart
  ggplot() +
  geom_col(
    aes(x = wordCount, y = Film),
    width = 0.7,
    alpha = 0.8
  ) +
  scale_x_continuous(expand = expansion(mult = c(0, 0.05))) +
  theme_minimal_vgrid()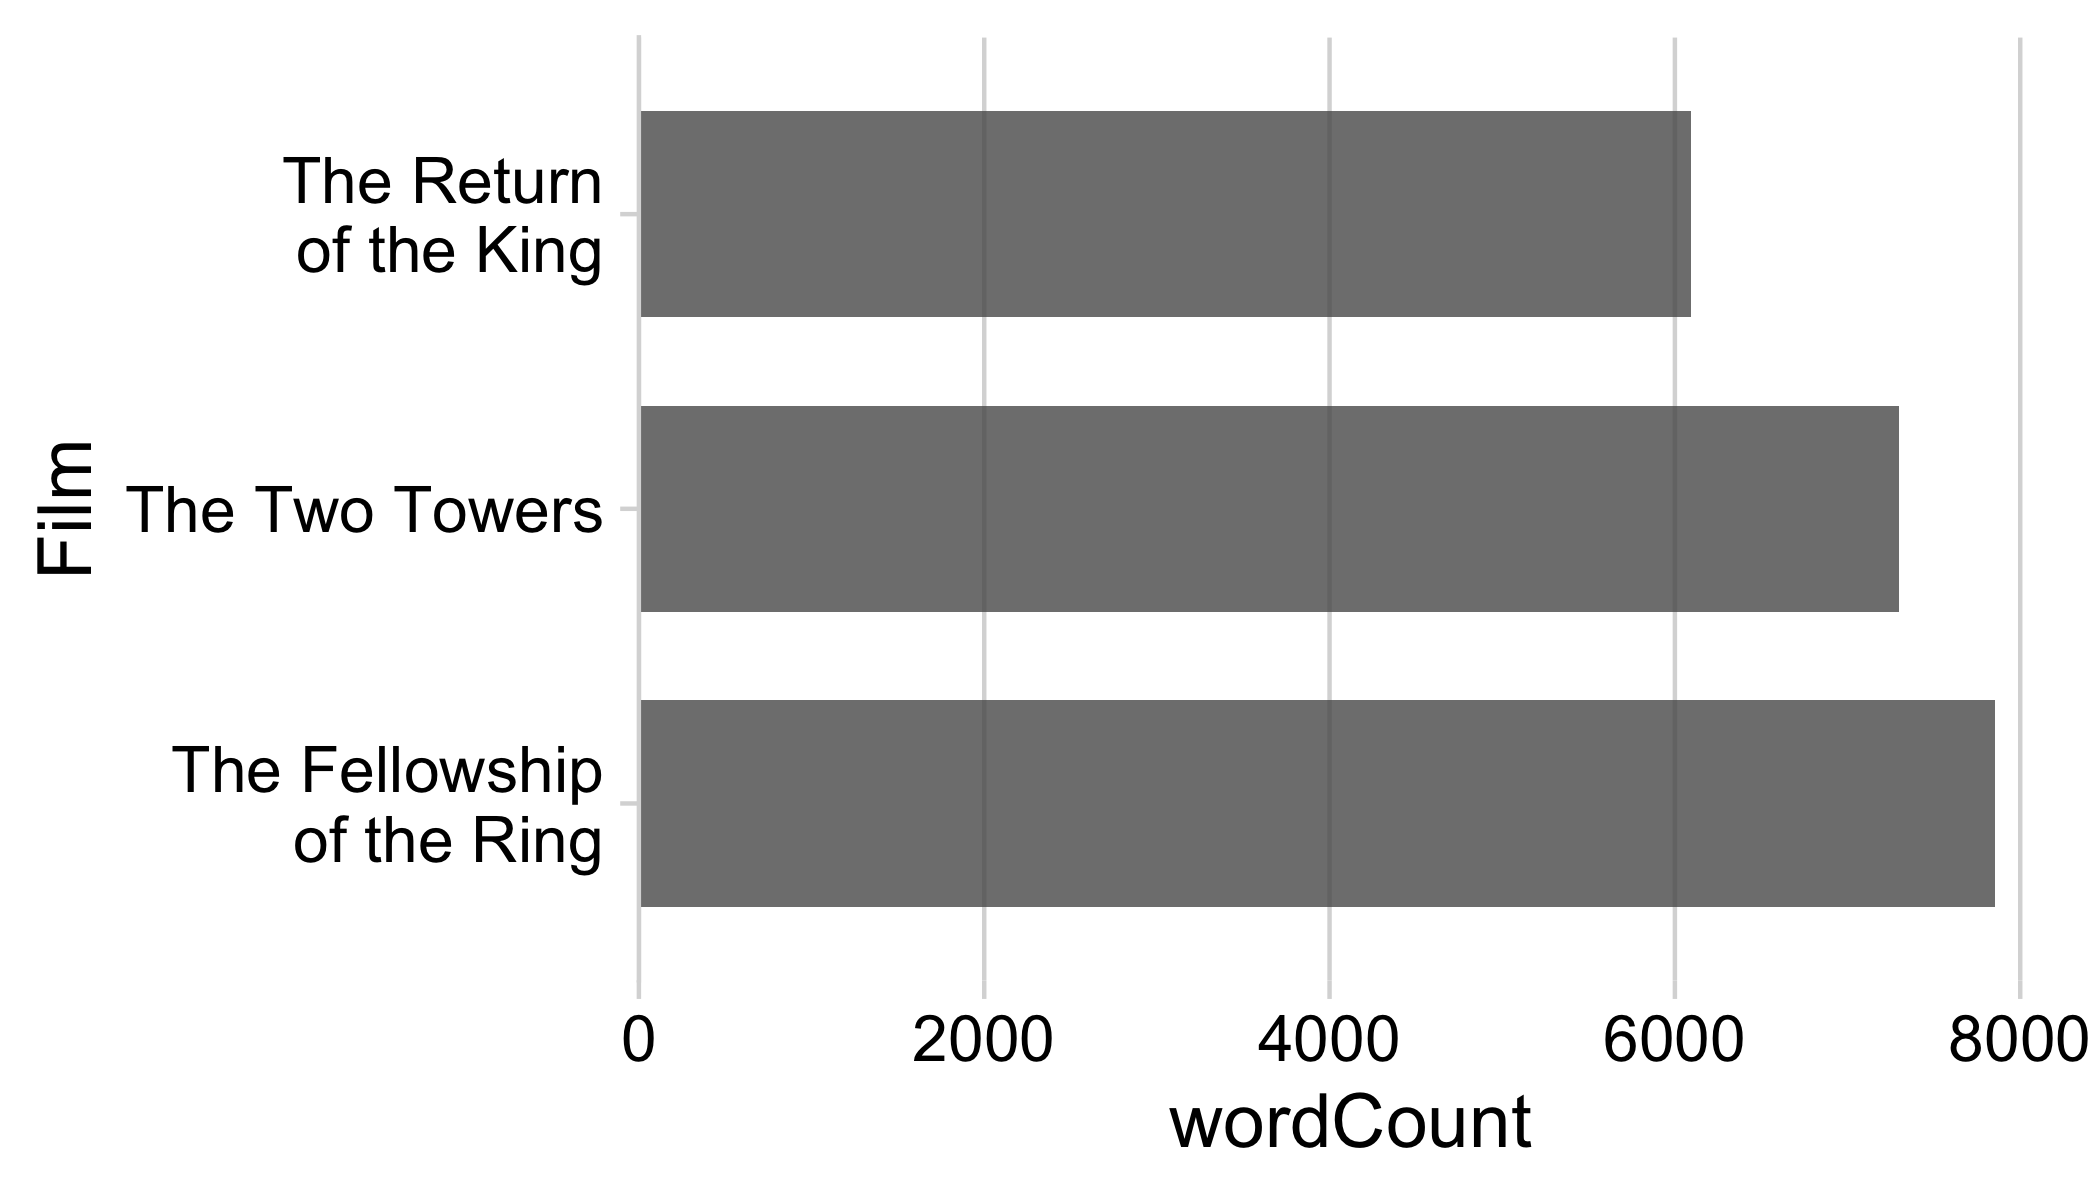
4. What if there are too many factor levels?
# Format the data frame
federal_spending %>%
  group_by(department) %>%
  summarise(
    rd_budget_bil = sum(rd_budget_mil) / 10^3
  ) %>%
  mutate(
    department = fct_reorder(department, rd_budget_bil)
  ) %>%
  # Make the chart
  ggplot() +
  geom_col(
    aes(x = rd_budget_bil, y = department),
    width = 0.7,
    alpha = 0.8,
    fill = "steelblue"
  ) +
  scale_x_continuous(
    expand = expansion(mult = c(0, 0.05))
  ) +
  theme_minimal_vgrid()
4. What if there are too many factor levels?
Strategy: Merge smaller factors into “Other” with fct_other()
# Format the data frame
federal_spending %>%
  mutate(
    department = fct_other(
      department,
      keep = c('DOD', 'HHS', 'NIH', 'NASA', 'DOE')
    )
  ) %>%
  group_by(department) %>%
  summarise(
    rd_budget_bil = sum(rd_budget_mil) / 10^3
  ) %>%
  mutate(
    department = fct_reorder(department, rd_budget_bil)
  ) %>%

  # Make the chart
  ggplot() +
  geom_col(
    aes(x = rd_budget_bil, y = department),
    width = 0.7,
    alpha = 0.8,
    fill = "steelblue"
  ) +
  scale_x_continuous(
    expand = expansion(mult = c(0, 0.05))
  ) +
  theme_minimal_vgrid()
4. What if there are really too many factor levels?

4. What if there are really too many factor levels?
Strategy: Keep top N, drop the rest with slice()
# Format the data frame
avengers %>%
  mutate(
    name_alias = fct_reorder(name_alias, appearances)
  ) %>%
  arrange(desc(appearances)) %>%
  slice(1:10) %>%

  # Make the chart
  ggplot() +
  geom_col(
    aes(x = appearances, y = name_alias),
    width = 0.7,
    alpha = 0.8
  ) +
  scale_x_continuous(
    expand = expansion(mult = c(0, 0.05))
  ) +
  theme_minimal_vgrid()
4. What if there are really too many factor levels?
slice() works with grouping too!
# Format the data frame
avengers %>%
  mutate(
    name_alias = fct_reorder(name_alias, appearances)
  ) %>%
  arrange(desc(appearances)) %>%
  group_by(gender) %>%
  slice(1:10) %>%

  # Make the chart
  ggplot() +
  geom_col(
    aes(
      x = appearances,
      y = name_alias,
      fill = gender
    ),
    width = 0.7,
    alpha = 0.8
  ) +
  scale_x_continuous(
    expand = expansion(mult = c(0, 0.05))
  ) +
  theme_minimal_vgrid()
Your turn - practice manipulating factors
Use the wildlife_impacts data to create the following plot

Show amounts with:


Bar chart
Dot chart


Lollipop chart

Bars are good for highlighting specific categories

Use lollipops when:
- The bars are overwhelming
- You’re not highlighting categories


Or use dots and don’t set axis to 0

How to make a Bar chart
# Summarize the data
federal_spending %>%
  group_by(department) %>%
  summarise(rd_budget_bil = sum(rd_budget_mil) / 10^3) %>%
  mutate(department = fct_reorder(department, rd_budget_bil)) %>%

  # Make chart
  ggplot() +
  geom_col(
    aes(x = rd_budget_bil, y = department),
    width = 0.7,
    alpha = 0.8,
    fill = 'steelblue'
  ) +
  scale_x_continuous(
    expand = expansion(mult = c(0, 0.05))
  ) +
  theme_minimal_vgrid()
Filling the bars with color
# Summarize the data
federal_spending %>%
  group_by(department) %>%
  summarise(rd_budget_bil = sum(rd_budget_mil) / 10^3) %>%
  mutate(
    department = fct_reorder(department, rd_budget_bil),
    is_dod = if_else(department == 'DOD', TRUE, FALSE)
  ) %>%

  # Make the chart
  ggplot() +
  geom_col(
    aes(x = rd_budget_bil, y = department, fill = is_dod),
    width = 0.7,
    alpha = 0.8
  ) +
  scale_x_continuous(
    expand = expansion(mult = c(0, 0.05))
  ) +
  theme_minimal_vgrid() +
  theme(legend.position = 'none')
The DOD’s R&D budget is nearly the same as all other departments combined

Filling the bars with color
# Summarize the data
federal_spending %>%
  group_by(department) %>%
  summarise(rd_budget_bil = sum(rd_budget_mil) / 10^3) %>%
  mutate(
    department = fct_reorder(department, rd_budget_bil),
    is_dod = if_else(
      department == 'DOD',
      TRUE,
      FALSE
    )
  ) %>%

  # Make the chart
  ggplot() +
  geom_col(
    aes(x = rd_budget_bil, y = department, fill = is_dod),
    width = 0.7,
    alpha = 0.8
  ) +
  scale_x_continuous(expand = expansion(mult = c(0, 0.05))) +
  scale_fill_manual(values = c('grey', 'steelblue')) +
  theme_minimal_vgrid() +
  theme(legend.position = 'none')
The DOD’s R&D budget is nearly the same as all other departments combined

How to make a Dot chart
Summarize data frame:
# Summarize the data
federal_spending %>%
  group_by(department) %>%
  summarise(
    rd_budget_bil = sum(rd_budget_mil) / 10^3
  ) %>%
  mutate(
    department = fct_reorder(department, rd_budget_bil)
  ) %>%

  # Make the chart
  ggplot() +
  geom_point(
    aes(x = rd_budget_bil, y = department),
    size = 2.5,
    color = 'steelblue'
  ) +
  theme_minimal_vgrid()
Dot chart of federal R&D spending by department
How to make a Lollipop chart
Summarize data frame:
# Summarize the data
federal_spending %>%
  group_by(department) %>%
  summarise(
    rd_budget_bil = sum(rd_budget_mil) / 10^3
  ) %>%
  mutate(
    department = fct_reorder(department, rd_budget_bil)
  ) %>%

  # Make the chart
  ggplot() +
  geom_segment(
    aes(x = 0, xend = rd_budget_bil, y = department, yend = department),
    color = 'grey'
  ) +
  geom_point(
    aes(x = rd_budget_bil, y = department),
    size = 2.5,
    color = 'steelblue'
  ) +
  theme_minimal_vgrid()
Lollipop chart of federal R&D spending by department
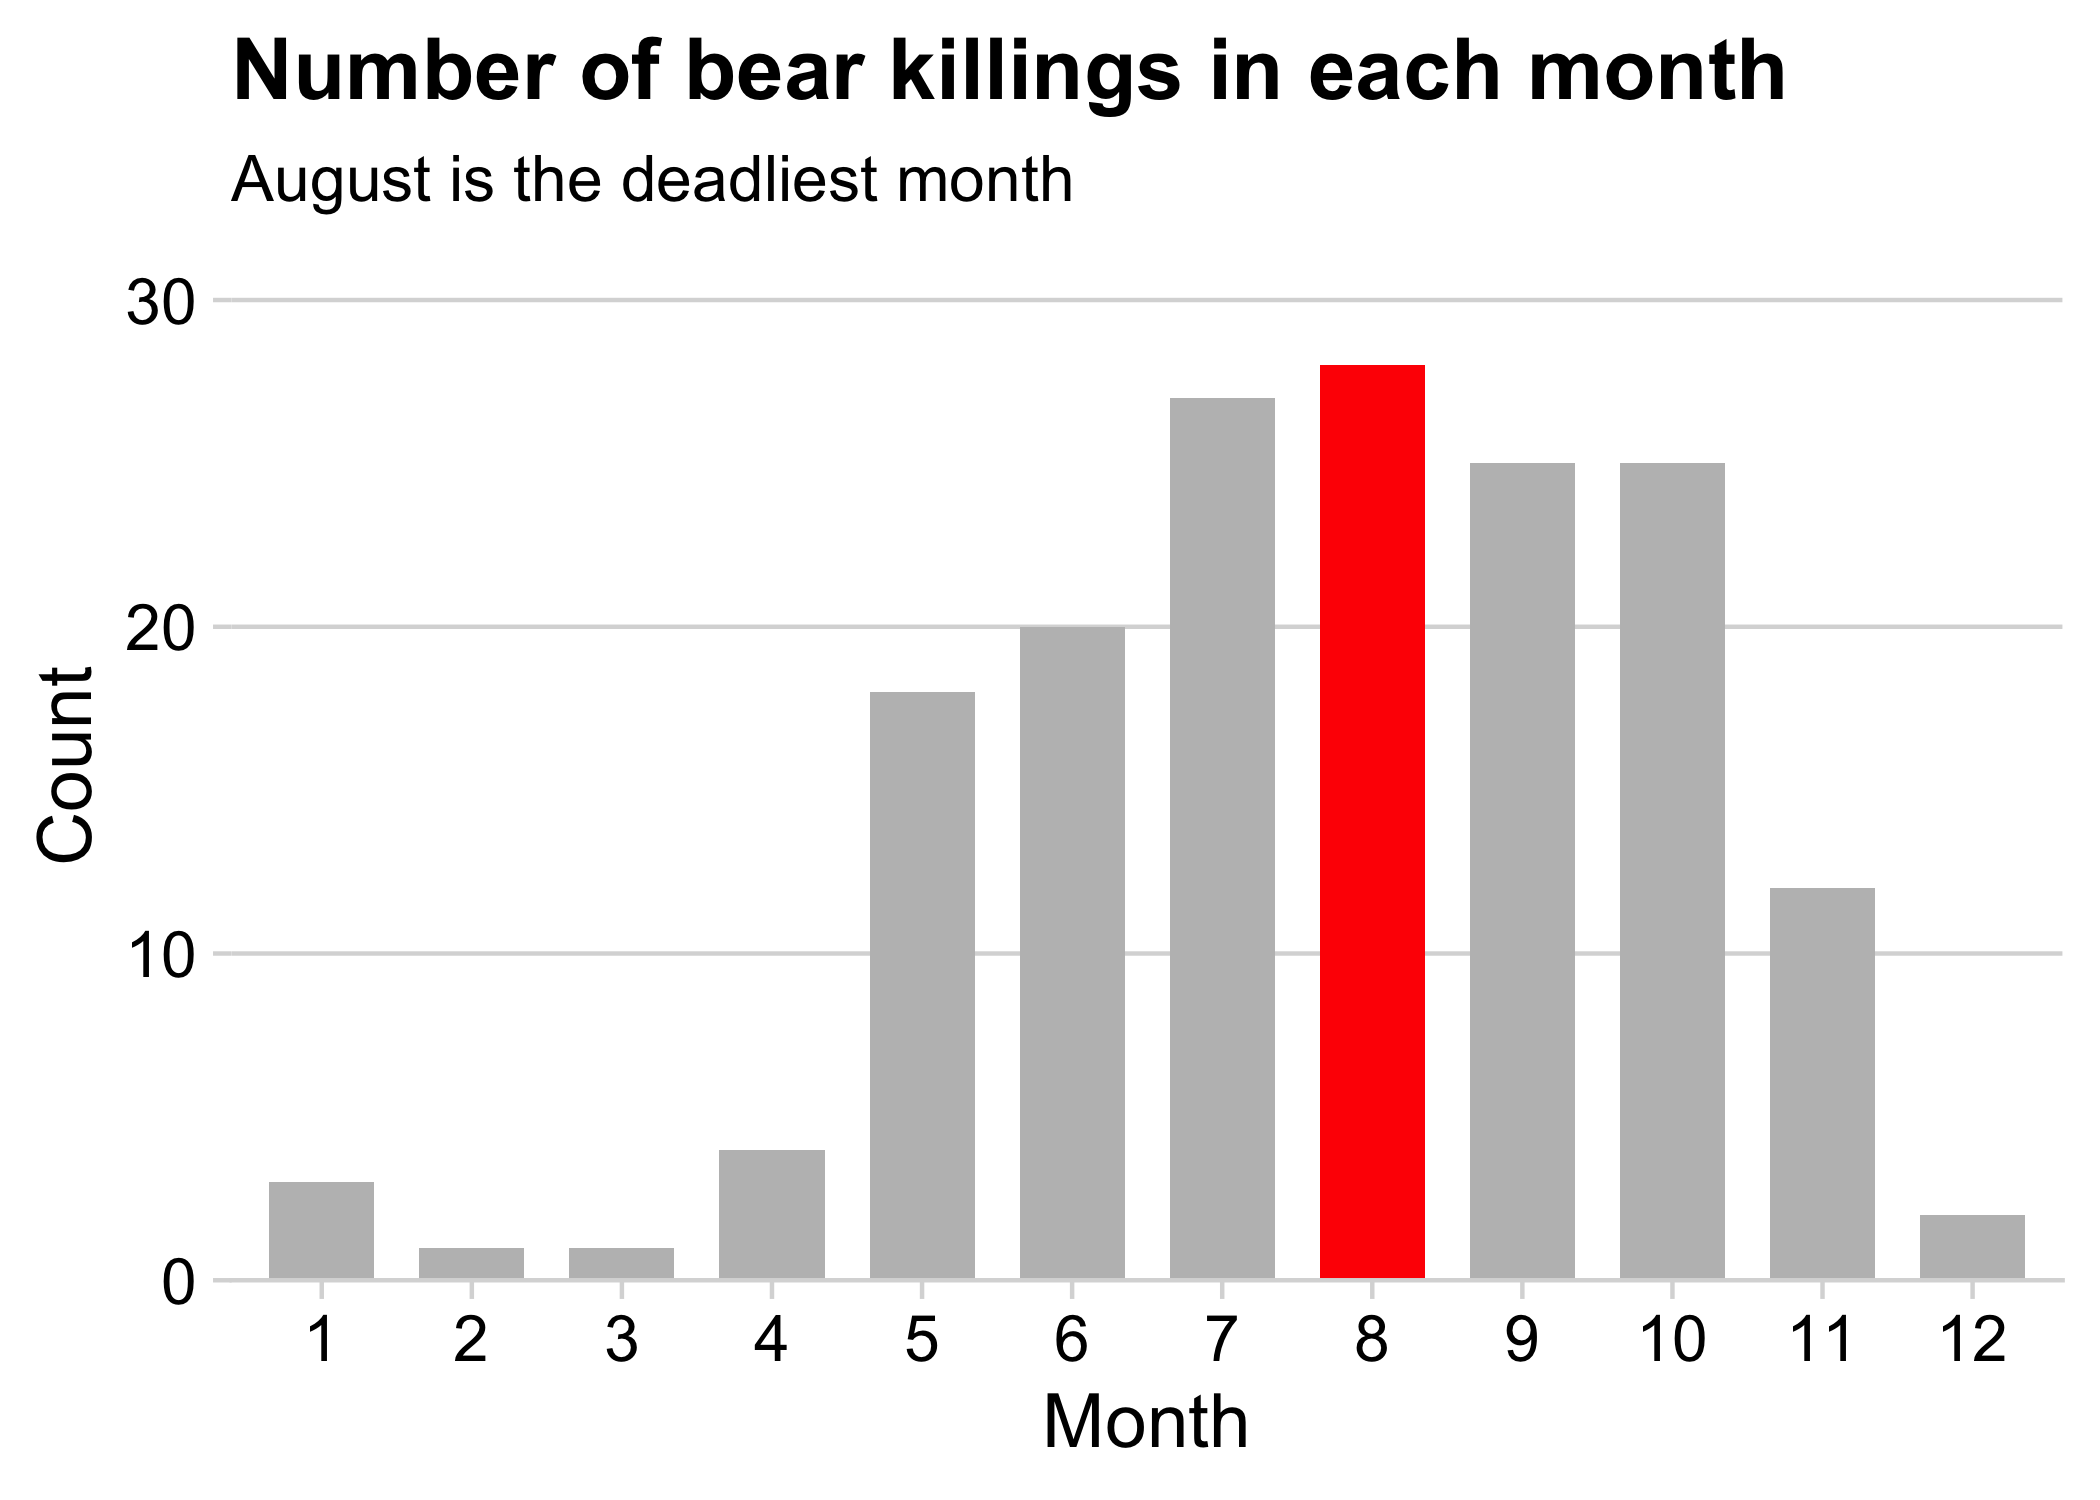
Your turn - practice plotting amounts
Create the following charts:
Data: bears
Data: milk_production

Show proportions with:


Bar charts

Pie charts

Waffle charts

Stacked bars
# Format the data
milk_production %>%
  filter(year == 2017) %>%
  mutate(state = fct_other(state, keep = c('California', 'Wisconsin'))) %>%
  group_by(state) %>%
  summarise(milk_produced = sum(milk_produced)) %>%

  # Make the chart
  ggplot() +
  geom_col(
    aes(x = "", y = milk_produced, fill = state),
    width = 0.7,
    alpha = 0.8
  ) +
  scale_y_continuous(
    expand = expansion(mult = c(0, 0.05))
  ) +
  theme_minimal_hgrid() +
  labs(
    x = NULL,
    y = 'Milk produced (lbs)',
    fill = 'State',
    title = '2017 Milk Production\nby State'
  )
Stacked bars - Rotated also looks good
# Format the data
milk_production %>%
  filter(year == 2017) %>%
  mutate(state = fct_other(state, keep = c('California', 'Wisconsin'))) %>%
  group_by(state) %>%
  summarise(milk_produced = sum(milk_produced)) %>%

  # Make the chart
  ggplot() +
  geom_col(
    aes(x = milk_produced, y = "", fill = state),
    width = 0.7,
    alpha = 0.8
  ) +
  scale_x_continuous(
    expand = expansion(mult = c(0, 0.05))
  ) +
  theme_minimal_hgrid() +
  labs(
    y = NULL,
    x = 'Milk produced (lbs)',
    fill = 'State',
    title = '2017 Milk Production by State'
  )
Stacked bars - not great for more than a few categories
# Format the data
milk_production %>%
  filter(year == 2017) %>%
  mutate(
    state = fct_other(
      state,
      keep = c('California', 'Wisconsin', 'New York', 'Idaho')
    )
  ) %>%
  group_by(state) %>%
  summarise(milk_produced = sum(milk_produced))

# Make the chart
ggplot() +
  geom_col(
    aes(x = "", y = milk_produced, fill = state),
    width = 0.7,
    alpha = 0.8
  ) +
  scale_y_continuous(
    expand = expansion(mult = c(0, 0.05))
  ) +
  theme_minimal_vgrid() +
  labs(
    x = NULL,
    y = 'Milk produced (lbs)',
    fill = 'State',
    title = '2017 Milk Production\nby State'
  )
Dodged bars
Better for part-to-whole comparison
# Format the data
milk_production %>%
  filter(year == 2017) %>%
  mutate(state = fct_other(state, keep = c('California', 'Wisconsin'))) %>%
  group_by(state) %>%
  summarise(milk_produced = sum(milk_produced)) %>%
  mutate(state = fct_reorder(state, milk_produced)) %>%

  # Make the chart
  ggplot() +
  geom_col(
    aes(x = milk_produced, y = state),
    width = 0.7,
    alpha = 0.8
  ) +
  scale_x_continuous(
    expand = expansion(mult = c(0, 0.05))
  ) +
  theme_minimal_vgrid() +
  labs(
    x = 'Milk produced (lbs)',
    y = 'State',
    title = '2017 Milk Production by State'
  )
Okay:
Better:

Dodged bars
milk_production %>%
  filter(year %in% c(1970, 2017)) %>%
  mutate(state = fct_other(state, keep = c('California', 'Wisconsin'))) %>%
  group_by(year, state) %>%
  summarise(milk_produced = sum(milk_produced)) %>%

  # Make the chart
  ggplot() +
  geom_col(
    aes(x = milk_produced, y = as.factor(year), fill = state),
    position = 'dodge',
    width = 0.7,
    alpha = 0.8
  ) +
  scale_x_continuous(
    expand = expansion(mult = c(0, 0.05))
  ) +
  theme_minimal_vgrid() +
  labs(
    x = 'Milk produced (lbs)',
    y = 'Year',
    fill = 'State',
    title = '1970 & 2017 Milk Production by State'
  )
Better for comparing total:

Better for comparing parts:

Where stacking is useful

- 2 to 3 groups
- Proportions over time
Where stacking is useful

- 2 to 3 groups
- Proportions over time
The Notorious P-I-E
Start with a bar chart
# Format the data
milk_production %>%
  filter(year == 2017) %>%
  mutate(state = fct_other(state, keep = c('California', 'Wisconsin'))) %>%
  group_by(state) %>%
  summarise(milk_produced = sum(milk_produced)) %>%

  # Make the chart
  ggplot() +
  geom_col(
    aes(x = "", y = milk_produced, fill = state),
    width = 0.7,
    alpha = 0.8
  ) +
  theme_minimal_hgrid() +
  labs(
    x = NULL,
    y = 'Milk produced (lbs)',
    fill = 'State',
    title = '2017 Milk Production\nby State'
  )
The Notorious P-I-E
Convert bar to pie with coord_polar()
# Format the data
milk_production %>%
  filter(year == 2017) %>%
  mutate(state = fct_other(state, keep = c('California', 'Wisconsin'))) %>%
  group_by(state) %>%
  summarise(milk_produced = sum(milk_produced)) %>%

  # Make the chart
  ggplot() +
  geom_col(
    aes(x = "", y = milk_produced, fill = state),
    width = 0.7,
    alpha = 0.8
  ) +
  coord_polar(theta = "y") +
  theme_minimal_hgrid() +
  labs(
    x = NULL,
    y = 'Milk produced (lbs)',
    fill = 'State',
    title = '2017 Milk Production by State'
  )
# Format the data
milk_production %>%
  filter(year == 2017) %>%
  mutate(state = fct_other(state, keep = c('California', 'Wisconsin'))) %>%
  group_by(state) %>%
  summarise(milk_produced = sum(milk_produced)) %>%
  arrange(desc(state)) %>%
  mutate(
    p = 100 * (milk_produced / sum(milk_produced)),
    label = str_c(round(p), '%')
  ) %>%

  # Make the chart
  ggplot() +
  geom_col(
    aes(x = "", y = milk_produced, fill = state),
    width = 0.7,
    alpha = 0.8
  ) +
  geom_text(
    aes(x = "", y = milk_produced, label = label),
    color = "white",
    size = 6,
    position = position_stack(vjust = 0.5)
  ) +
  coord_polar(theta = "y") +
  theme_map() +
  labs(
    x = NULL,
    y = NULL,
    fill = 'State',
    title = '2017 Milk Production by State'
  )
The Notorious P-I-E
Final chart with labels & theme_map()

Pies are still useful if the sum of components matters


The best pies are square pies

https://eagereyes.org/blog/2016/a-reanalysis-of-a-study-about-square-pie-charts-from-2009
Waffle plots
library(waffle)

# Format the data
milk_production %>%
  filter(year == 2017) %>%
  mutate(state = fct_other(state, keep = c('California', 'Wisconsin'))) %>%
  group_by(state) %>%
  summarise(milk_produced = sum(milk_produced)) %>%
  mutate(milk_produced = milk_produced / 10^9) %>%

  # Make the chart
  ggplot() +
  geom_waffle(
    aes(fill = state, values = milk_produced),
    color = "white",
    size = 1,
    n_rows = 10
  ) +
  scale_x_discrete(expand = c(0, 0)) +
  scale_y_discrete(expand = c(0, 0)) +
  theme_minimal() +
  labs(
    fill = 'State',
    x = NULL,
    y = NULL,
    title = '2017 Milk Production by State',
    subtitle = '(1 square = 1 billion lbs)'
  )
Use values between 100 - 1,000
(You don’t want 1,000,000,000 boxes!)
#> # A tibble: 3 × 2
#>   state      milk_produced
#>   <fct>              <dbl>
#> 1 California          39.8
#> 2 Wisconsin           30.3
#> 3 Other              145.
Waffle plots
library(waffle)

# Format the data
milk_production %>%
  filter(year == 2017) %>%
  mutate(state = fct_other(state, keep = c('California', 'Wisconsin'))) %>%
  group_by(state) %>%
  summarise(milk_produced = sum(milk_produced)) %>%
  mutate(milk_produced = milk_produced / 10^9) %>%

  # Make the chart
  ggplot() +
  geom_waffle(
    aes(fill = state, values = milk_produced),
    color = "white",
    size = 1,
    n_cols = 10,
    flip = TRUE
  ) +
  scale_x_discrete(expand = c(0, 0)) +
  scale_y_discrete(expand = c(0, 0)) +
  theme_minimal() +
  labs(
    fill = 'State',
    x = NULL,
    y = NULL,
    title = '2017 Milk Production by State',
    subtitle = '(1 square = 1 billion lbs)'
  )
Use flip = TRUE for vertical
#> # A tibble: 3 × 2
#>   state      milk_produced
#>   <fct>              <dbl>
#> 1 California          39.8
#> 2 Wisconsin           30.3
#> 3 Other              145.
library(waffle)

# Format the data
milk_production %>%
  filter(year %in% c(1970, 2017)) %>%
  mutate(state = fct_other(state, keep = c('California', 'Wisconsin'))) %>%
  group_by(year, state) %>%
  summarise(milk_produced = sum(milk_produced)) %>%
  mutate(milk_produced = milk_produced / 10^9) %>%

  # Make the chart
  ggplot() +
  geom_waffle(
    aes(fill = state, values = milk_produced),
    color = "white",
    size = 1,
    n_rows = 10,
    flip = TRUE
  ) +
  facet_wrap(vars(year), strip.position = 'bottom') +
  scale_x_discrete(expand = c(0, 0)) +
  scale_y_discrete(expand = c(0, 0)) +
  theme_minimal() +
  labs(
    fill = 'State',
    x = NULL,
    y = NULL,
    title = '1970 & 2017 Milk Production by State',
    subtitle = '(1 square = 1 billion lbs)'
  )
Use facet_wrap for side-by-side waffles
#> # A tibble: 3 × 2
#>   state      milk_produced
#>   <fct>              <dbl>
#> 1 California          39.8
#> 2 Wisconsin           30.3
#> 3 Other              145.
Stacked bars
Dodged bars
Pie chart

Waffle chart
