head(df )

# A tibble: 6 x 3
  country    year   sales
  <chr>     <dbl>   <dbl>
1 Argentina  2019  333226
2 Australia  2019  799263
3 Austria    2019  320381
4 Belgium    2019  550008
5 Brazil     2019 2262073
6 Bulgaria 2019 35371Mini Project 1: Data Cleaning
Due: Sep 27 by 11:59pm
Weight: This assignment is worth 8% of your final grade.
Purpose: When you start looking for data to address your project for this course, you will inevitably come across some rather messy data. Fear not! After completing this assignment, you will be well-prepared to tackle the messiness of real-world data! This assignment will put your data wrangling and cleaning skills to the test and will challenge you to become a master data janitor!
Assessment: Your submission will be assessed using the rubric at the bottom of this page.
Background
For this assignment, you’ll be cleaning up a data set from the International Organization of Motor Vehicle Manufacturers (OICA). Your job for this assignment is to clean up a relatively messy data file that contains sales of passenger cars by country in the years 2019, 2020, and 2021. Your final product should be a tidy (long format) data frame with three columns: country, year, and sales. It should look like this:
That’s the goal - in this assignment, we’ll walk through how to get there step-by-step.
1. Get organized
Download and unzip this template for your project, then open the report.Rproj file.
Once RStudio opens, click on the report.Rmd file. That is the primary file you will edit to conduct your analysis.
2. Document the data
Inside the data folder, there is a README.md file with some missing information. Click on that file and edit it to fill in the missing information. Here is some info that will help:
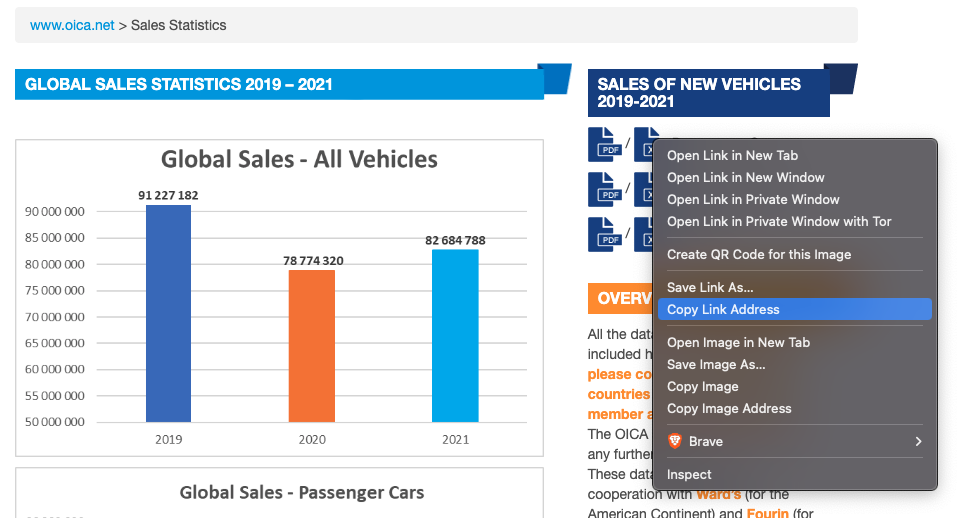
The main data file we’ll be working with is the pc_sales_2021.xlsx file in the data folder. You can find this file online at https://www.oica.net/category/sales-statistics/. The link to the original data file can be found by right-clicking on the Excel icon on the right side of the page, like this:
3. Preview the data
With messy Excel files, it is often helpful to first open and view them so you can learn about what might be needed to clean them up in R, such as how many lines you may need to skip at the top when reading in the data. To make sure Excel doesn’t corrupt your data, make a copy of the Excel file and open that copy with Microsoft Excel. You can keep that copy open throughout your data cleaning journey and can be confident that you haven’t corrupted the original file!
4. Load the data
Use the read_excel() function from the readxl package to read in the pc_sales_2021.xlsx data file. Make sure you use the sheet argument to specify which sheet to read in as well as the skip argument to specify how many lines to skip at the top of the file.
5. Clean the names
When reading in a messy data file, one of the first things you’ll want to do is clean up the names. Follow these steps:
- Use the
clean_names()function from thejanitorpackage to clean all the names. - Use the
rename()function to change the name of the column that contains country names tocountry.
6. Reshape the data
The data are clearly in a “wide” format because the last three columns are labeled as years, but the values in those columns are sales. We’ll want to reshape that into just two columns: year & sales. To do so, follow these steps:
- Use the
select()function to keep only the columns with country names and sales numbers (some of the columns report percent growth - we want to drop those). - Use the
pivot_longer()function to reshape the data into a long format structure with the following names:country,year, andsales.
7. Convert year to a number
Our data now have a tidy structure, but the values under the year column is a character with values like this in it: q1_q4_2019. We need to get rid of those pesky q1_q4_ things and just keep the year value. Follow these steps:
- Use the
separate()function withsep = "_"to split up theyearvariable into three columns. You can use theintoargument to give the new columns new names, such asc("drop1", "drop2", "year"). This will convertyearinto three columns: one containing theq1value, another containingq4, and the last one containing the year values. - Once you’ve got those columns split up, you can use the
select()function to drop the columns containing theq1andq4values. - Finally, use
mutate()to convert theyearcolumn to a numeric type.
8. Drop rows that aren’t countries
This step is probably the messiest step. The country column contains a mix of countries and whole regions (e.g. "EUROPE"). We only want countries, so we need to use filter() to drop rows that contain regions. I’ve done you a favor by listing all of the regions in the data as a vector below - you can copy-paste it to use in filtering out these rows:
regions <- c(
    "EUROPE",
    "EU 27 countries + EFTA + UK",
    "OTHER COUNTRIES",
    "RUSSIA, TURKEY & OTHER EUROPE",
    "AMERICA",
    "NAFTA",
    "AFRICA",
    "CENTRAL & SOUTH AMERICA",
    "ASIA/OCEANIA/MIDDLE EAST",
    "ASEAN",
    "ALL COUNTRIES/REGIONS",
    "OTHER COUNTRIES/REGIONS",
    "TOTAL OICA MEMBERS"
)
When finished filtering out the regions, convert the country values from “upper” case to “title” case (e.g. "FRANCE" should become "France").
9. Rearrange the rows
Use the arrange() function to sort the rows by year and country.
10. Save the cleaned file
Save your cleaned data frame to your data folder as a CSV file. Name the file my_clean_data.csv.
11. Knit your report
Click the “knit” button to compile your .Rmd file into a html web page. Then open the report.html file in a web browser and proofread your report. Does all of the formatting look correct?
12. Submit
To submit this assignment, create a zip file of all the files in your R project folder for this assignment. Name the zip file mini1-netID.zip, replacing netID with your netID (e.g., mini1-jph.zip). Then copy that zip file into the “submissions” folder in your Box folder created for this class (the Box folder is named your GW netID).
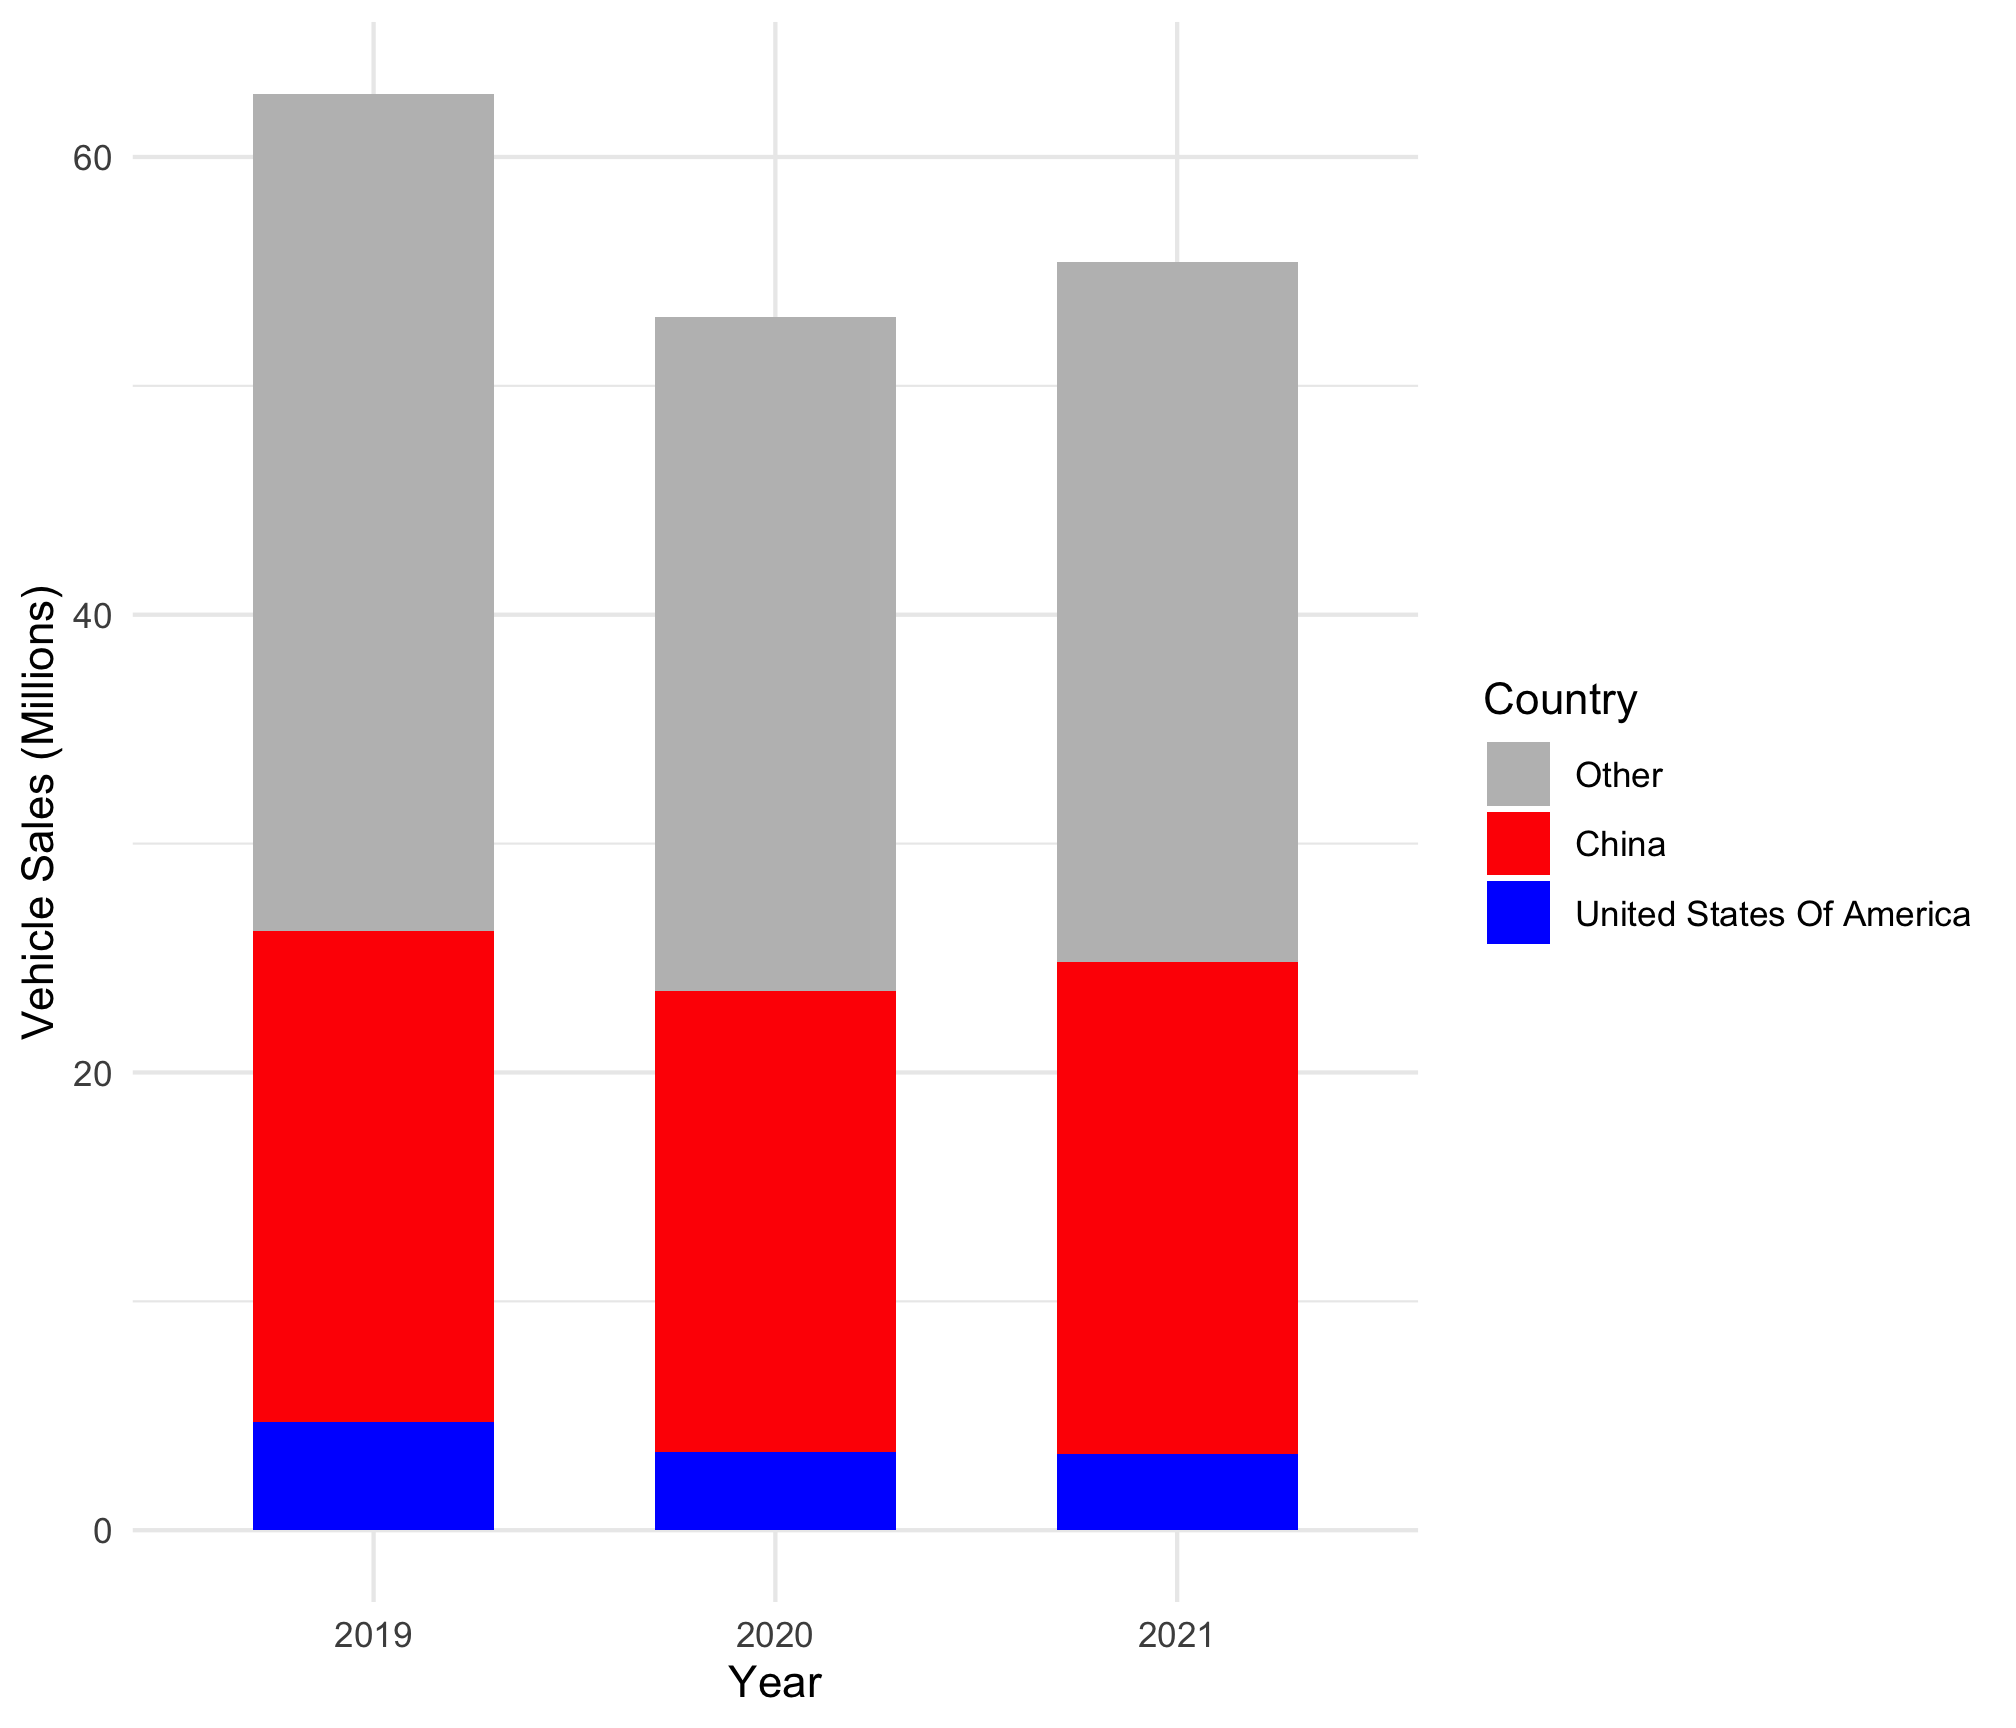
BONUS: Make a summary visualization (+5%)
For a 5% bonus, add a code chunk at the bottom of your report to generate the plot below. If your cleaned data is not properly formatted, you can read in the pc_sales_clean.csv file and use it to make the plot.
Some hints to perfectly replicate the figure:
- Consider using
ifelse()to make a new variable for the bar color based on thecountryvariable. - You can use
fct_relevel()to re-order the country factors (the order of how they are stacked). - The fill colors are
'grey','red', and'blue'. - The theme is
theme_minimal().
Grading Rubric
35 Total Points
| Category | Excellent | Good | Needs work |
|---|---|---|---|
| Organization & Formatting | 5 All formatting guidelines are followed; YAML is correctly filled out. |
4 Most formatting guidelines are followed; YAML is correctly filled out. |
3 Several or all formatting guidelines not followed; YAML contains elements that aren't updated from the template; template file wasn’t used. |
| Data Documentation | 5 The README file included in the template was updated with thoughtful and accurate information about the data. |
4 The README file included in the template was updated, but some of the information was missing or inaccurate. |
3 The README file included in the template was not updated, missing, or most of the information in it was inaccurate. |
| Data Cleaning | 18 - 20 All cleaning steps are completed and the resulting "clean" data frame is exactly (or very close to) the desired final state. |
15 - 17 All cleaning steps are completed, though there are one or two significant errors that prevents the resulting "clean" data frame from being in the desired final state. |
10 - 14 More than one of the cleaning steps are missing; multiple errors prevent the resulting "clean" data frame from being in the desired final state. |
| Technical things | 5 All code runs without errors; the html file can be compiled from the Rmd; all files included in the submitted .zip file. |
4 Code has only one or two error, otherwise runs; all files included in the submitted .zip file. |
3 Code has multiple errors; html file cannot be rendered without significant changes to the Rmd file; submitted .zip file is missing components necessary to reproduce analysis. |
:::