Due: Oct 04 by 11:59pm
Weight: This assignment is worth 9% of your final grade.
Purpose: When you start looking for data to address your project for this course, you will inevitably come across some rather messy data. In this assignment, you will direct Claude Code to do the actual cleaning work – but the agent cannot decide what counts as a “country” versus a region in this data, and it cannot be trusted to catch its own mistakes. Your job is the part the agent cannot do: plan the strategy, supervise the implementation, and verify that the result is actually correct.
Assessment: Your submission will be assessed using the rubric at the bottom of this page.
Your mission, should you choose to accept it, is to clean up a relatively messy data file that contains sales of passenger cars by country between 2019 and 2024. The data are from the International Organization of Motor Vehicle Manufacturers (OICA).
Your final product should be a tidy (long format) data frame with three columns: country, year, and sales. It should look like this:
#> # A tibble: 6 × 3
#>   country    year   sales
#>   <chr>     <dbl>   <dbl>
#> 1 Argentina  2019  333183
#> 2 Australia  2019  799263
#> 3 Austria    2019  320381
#> 4 Belgium    2019  550008
#> 5 Brazil     2019 2262073
#> 6 Bulgaria   2019   35371
#> # A tibble: 6 × 3
#>   country                   year   sales
#>   <chr>                    <dbl>   <dbl>
#> 1 Ukraine                   2024   69599
#> 2 United Arab Emirates      2024  268876
#> 3 United Kingdom            2024 1952778
#> 4 United States Of America  2024 2984039
#> 5 Uzbekistan                2024  166058
#> 6 Vietnam                   2024  291797
With this in mind, your job is to develop and execute a strategy to go from the raw excel file to this cleaned version of the data.
1. Get organized
Open your course repo (eda-f26/eda-netID) in Positron using File › Open Folder and open it to the mini1 folder. If you haven’t cloned your course repo yet, follow the steps in HW1 first.
Everything for this assignment lives in the mini1 folder. Inside it you’ll find report.qmd and a data folder. Click on report.qmd. That is the primary file you will edit to conduct your analysis.
Paths inside report.qmd are relative to the mini1 folder, so refer to the data as file.path('data', 'pc_sales_2024.xlsx').
2. Document the data
Inside the data folder, there is a README.md file with some missing information. Click on that file and edit it to fill in the missing information. Here is some info that will help:
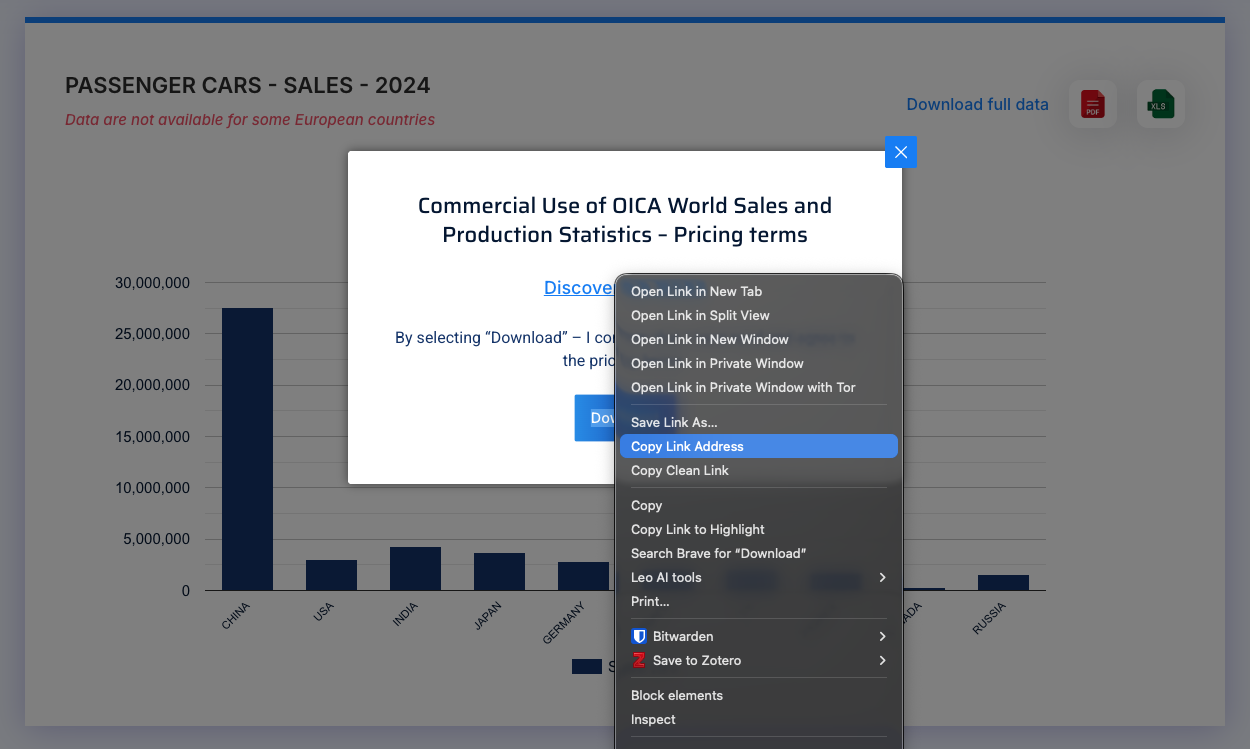
The main data file we’ll be working with is the pc_sales_2024.xlsx file in the data folder. You can find this file online at https://oica.net/sales-statistics/. We’re using the “Passengers Cars” data (the “pc” in pc_sales_2024). The link to the original data file can be found by first clicking on the little Excel icon, then right-clicking on the “Download” pop-up, like this:
3. Preview the data
With messy Excel files, it is often helpful to first open and view them so you can learn about what might be needed to clean them up in R, such as how many lines you may need to skip at the top when reading in the data. To make sure Excel doesn’t corrupt your data, make a copy of the Excel file and open that copy with Microsoft Excel. You can keep that copy open throughout your data cleaning journey and can be confident that you haven’t corrupted the original file!
4. Load the data
Have Claude Code read in the pc_sales_2024.xlsx data file using read_excel() from the readxl package. Look at what comes back – does it need to skip any rows while reading it in?
Just get to a point where the data is being read into R, then pause and think about your cleaning strategy.
5. Develop Your Strategy
Before you prompt the agent to write any cleaning code, you need a plan. This is the step an agent cannot do for you: it doesn’t know what counts as a “country” versus a region or subtotal in this particular file, and it has no reason to check its own assumptions unless you tell it what to check.
Examine the raw data yourself using functions like head() and glimpse(), and look at the copy you opened in Excel, to understand the structure of the data.
Write out your strategy: Create a numbered list of the major steps needed to transform this messy data into the target format shown above. Consider:
- What needs to happen to the column names?
- Do you need to reshape the data (wide vs long format)?
- Which rows are actual countries, and which are regions, subtotals, or residual “other” categories that need to be excluded? How will you tell them apart?
- What cleaning is needed in each column?
- How will you get the data into the final column structure?
Deliverable: In your report.qmd file, write down your strategy with numbered steps describing your planned approach before writing any cleaning code. Be specific – this is what you’ll hand to the agent, and it’s also what you’ll check the agent’s output against later.
6. Direct the Agent
Now prompt Claude Code to implement your strategy, step by step. Review what it produces as it goes – read the code, read the diffs, and check the output at each stage rather than accepting the final result all at once.
Important: The final dataset should contain:
- Only observations of countries (not regions, subtotals, or totals)
- Years as numbers (e.g., 2019, 2020, 2021, 2022, 2023, 2024)
- Sales values as numbers
- Country names in title case (e.g., “France” not “FRANCE”)
- Rows arranged by year, then country
If the agent’s first attempt gets something wrong (e.g., misses a row that should have been excluded, skips the wrong number of header rows, silently drops data during a type conversion) that’s expected, not a failure on your part. Catching it is the point of the next step.
Deliverable: Clean, well-organized code (in one or more code chunks) in your report that produces the target dataset.
Note: Claude code should directly edit your report.qmd file.
7. Verify
Getting output that looks clean is not the same as verifying it is clean. This is the step that’s actually graded most heavily in this assignment, and it’s the one an agent cannot do reliably on its own. If you simply ask Claude Code “is this correct?”, it will generally tell you yes, whether or not it actually checked anything. You need to design and interpret the checks yourself, even if the agent helps write the code that runs them.
Run and document at least these checks:
- Shape check: does the number of rows equal the number of countries times the number of years, with no gaps?
- Duplicate check: are there any repeated country-year combinations (a sign that a name inconsistency split one country into two rows)?
- Missing-value audit: are there any
NAs in the sales column? A number that failed to convert (e.g. because of a comma or stray character) can silently turn into NA without an error.
- An independent reconciliation: the raw file itself contains region and subtotal rows. Do the numbers you kept add up sensibly against numbers already reported in the source file, without relying on any answer key? (Careful: not every row labeled “total” measures the same thing – check what a total actually represents before trusting it.)
- Manual spot-checks: pick 3-5 specific country/year values and look them up by hand in the raw Excel file to confirm they match your cleaned data exactly.
Deliverable: A verification section in your report showing the checks you ran, their output, and what you concluded – including anywhere you found and corrected a mistake in the agent’s first attempt. If nothing was wrong, say what you checked to be confident of that, specifically.
8. Document Your Process
Save your cleaned data as my_clean_data.csv in your mini1 folder, next to report.qmd.
Write a brief reflection addressing:
- What were the 2-3 biggest challenges in cleaning this data?
- Where, if anywhere, did Claude Code’s output need to be corrected, and how did you catch it?
- What specifically did you check to be confident your cleaned data is correct (beyond “it looked right”)?
- What would you do differently if you encountered similar data again?
Deliverable: Saved my_clean_data.csv file in your mini1 folder, and written reflection (~4-6 sentences).
9. Render and submit
To submit your assignment, follow these instructions:
- Render your
report.qmd file by either clicking the “Preview” button in Positron or running quarto render in the terminal.
- Open the rendered
report.html file and proofread it – make sure there are no errors and all the formatting looks as you expected.
- Run
/export in Claude Code and save the result as transcript.md in your mini1 folder. This is a required part of your submission – it’s how your verification is checked.
- Check that your
mini1 folder contains exactly four files – report.qmd, report.html, transcript.md, and my_clean_data.csv – plus the data folder.
- Commit and push your work using GitHub Desktop: look at the diff, write a short commit message, click Commit, then Push.
Your work isn’t submitted until you’ve pushed it. Committing only saves the change on your own computer – go look at your repo on GitHub.com and confirm your work is actually there before you call this done.
BONUS: Make a summary visualization (+5%)
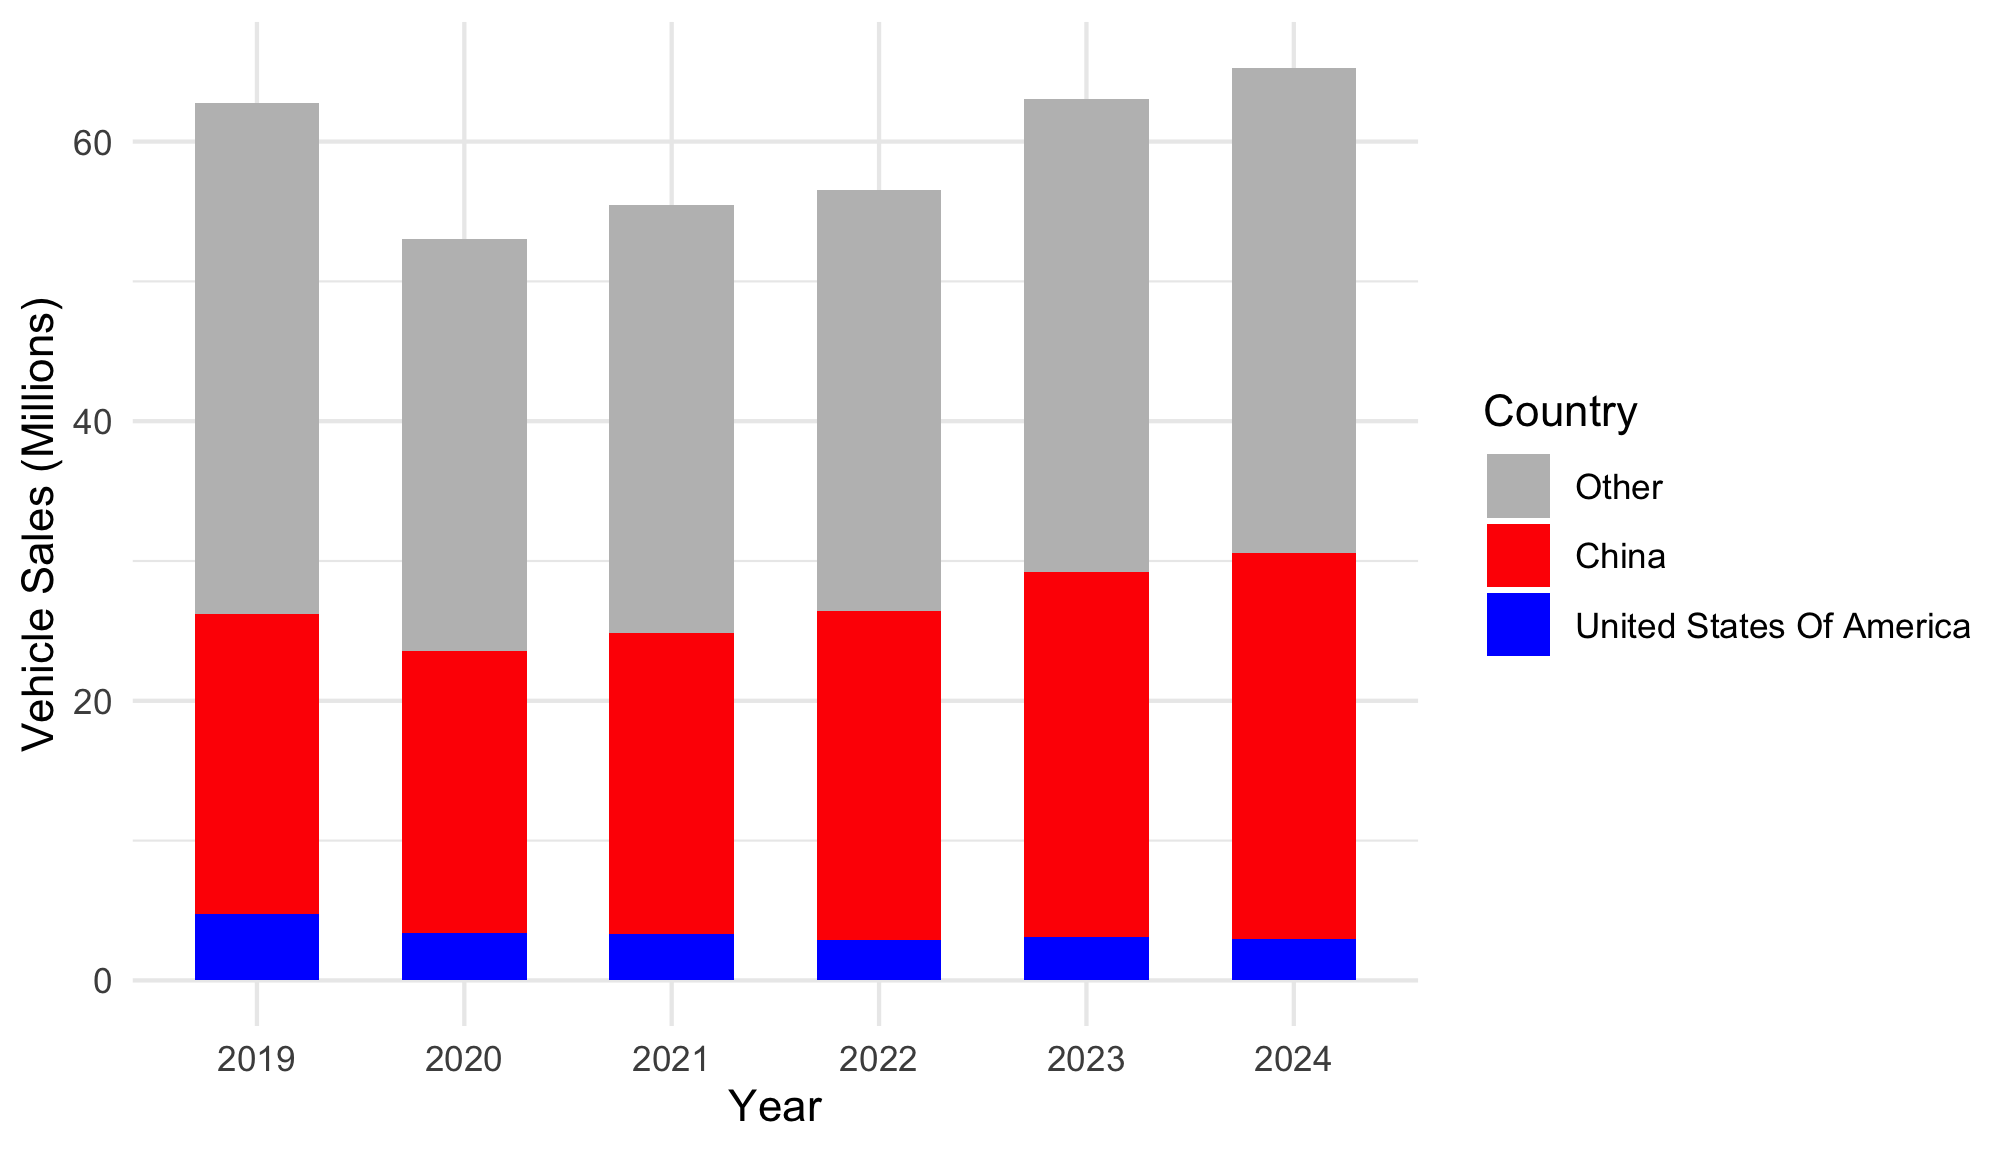
For a 5% bonus, add a code chunk at the bottom of your report to generate the plot below, using your own cleaned data from Step 6.
Some hints to perfectly replicate the figure:
- Consider using
ifelse() to make a new variable for the bar color based on the country variable.
- You can use
fct_relevel() to re-order the country factors (the order of how they are stacked).
- The fill colors are
'grey', 'red', and 'blue'.
- The theme is
theme_minimal().
Grading Rubric
40 Total Points
| Organization & Formatting |
5
All formatting guidelines are followed; YAML is correctly filled out. |
4
Most formatting guidelines are followed; YAML is correctly filled out. |
3
Several or all formatting guidelines not followed; YAML contains elements that aren't updated from the provided starter file; the provided report.qmd wasn't used. |
| Data Documentation |
5
The README file included in the mini1 data folder was updated with thoughtful and accurate information about the data. |
4
The README file included in the mini1 data folder was updated, but some of the information was missing or inaccurate. |
3
The README file included in the mini1 data folder was not updated, missing, or most of the information in it was inaccurate. |
| Strategy |
5
A specific, numbered strategy is written before implementation; it correctly identifies the key judgment calls in the data (e.g. distinguishing countries from regions/subtotals) and describes how the data will be reshaped and cleaned. |
4
A strategy is present and numbered, but is vague in places or misses one of the key judgment calls. |
3
Strategy is missing, generic/copied from the assignment prompt, or clearly written after the cleaning code rather than guiding it. |
| Data Cleaning |
9 - 10
The resulting "clean" data frame is exactly (or very close to) the desired final state. |
7 - 8
The resulting "clean" data frame has one or two significant errors that prevent it from being in the desired final state. |
4 - 6
Multiple errors prevent the resulting "clean" data frame from being in the desired final state. |
| Verification |
9 - 10
Runs and reports on multiple concrete, specific checks (e.g. row/shape counts, a duplicate check, an NA audit, an independent reconciliation against totals reported in the source file, manual spot-checks) with real output shown; clearly documents at least one place where Claude's first attempt was wrong and how it was caught and corrected. The exported transcript corroborates that the student -- not just the agent -- did the verifying and reasoning. |
6 - 8
Runs some real checks, but they are generic (e.g. only `head()`/`glimpse()`) or the write-up asserts correctness without independent evidence. The transcript suggests verification was mostly outsourced to the agent (e.g. "please verify this is correct") rather than the student directly checking. |
0 - 5
No real verification beyond visually inspecting the output. Claims the data was "double checked" or "verified" with no supporting checks in the report or evidence in the transcript. |
| Technical & Process |
5
All code runs without errors; the mini1 folder pushed to GitHub contains exactly report.qmd, report.html, transcript.md, and my_clean_data.csv. |
4
Code has only one or two errors, otherwise runs; the pushed mini1 folder is missing one of the four required files or includes extra clutter. |
3
Code has multiple errors; html file cannot be rendered without significant changes; work was never pushed to GitHub; or the pushed mini1 folder is missing report.qmd, report.html, transcript.md, or my_clean_data.csv. |